cvalue13
Well-known member
- Joined
- Aug 17, 2022
- Threads
- 74
- Messages
- 7,153
- Reaction score
- 13,769
- Location
- Austin, TX
- Vehicles
- F150L
- Occupation
- Fun-employed
- Thread starter
- #1
There are smarter cookies in here than me, especially when it comes to maths and plotting ramps and production numbers.
So I did the ham-fisted job below, to send those smarter folks into a “you’ve done it wrong” rage, and compel them to make a better analysis.
so please correct me to death!
here’s my question and attempt;
I’d like to know how many CTs might be built total, at each 1st of the month during 2024 - assuming the ramp hits a maximum run rate of 225K/year sometime in 2025, and a mid ramp inflection point 125K/yr run rate sometime during 2024.
In the Q3 call, Musk said that for 2024 they are targeting hitting a run rate of 125,000 units. That ~means only, that at some point in 2024 they will begin to average ~335 units built / day.
If they reach that daily run rate only on the last day of 2024, they will build a lot less than 125K total trucks over the calendar year 2024.
That being only an extreme example to make the point that how many total Cybertrucks are built of CY 2024 depends when during the year they reach a maximum daily run rate of 335s. Even in that example, the exact number of units built depends on what, exactly, “S-cur ve” (as Musk mentions but never details) there is in the ramp period (between Jan 1 ‘24 and the date they hit the target run rate).
Because we know that Tesla’s ultimate target is a run rate of 250K sometime in 2025 (670 units / day), we can’t determine how many CTs might be built in CY 2024 without letting the ramp continue upwards after they hit the 125K run rate, through to when they hit the eventual max 250K run rate (which is the capacity limit of the existing line).
Under this model, and curious about the number of CTs that might be built in 2024 (or 2025 for that matter), I did some back-of-napkin math (ie OpenAI).
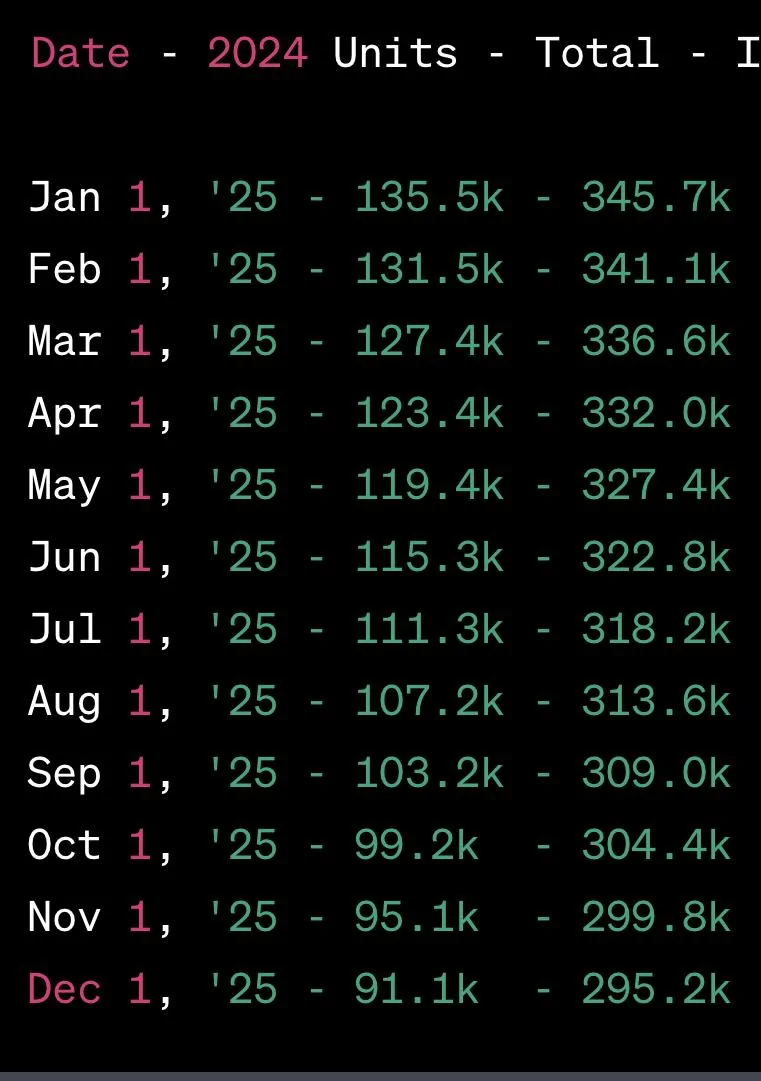
For simplicity, I looked at only the hypos where the daily max run rate max of 250K was achieved on either Jan. 1st ‘25 (the most optimistic scenario), or the first of each next month, through to Dec. 1st ‘25 (the least optimistic scenario).

In the most optimistic scenario (max run rate of 670 units/day is achieved on Jan. 1, 2025) it would mean ~135K CTs are built in 2024 total. In the most pessimistic scenario (max run rate of 670 units/day isn’t achieved until Dec. 1, 2025) ~91K CTs are built in 2024 total.
If we instead take Musk’s comments regarding ‘18 months from now’ as the relevant point of reach 670 units/day, that would be April 2025, in which case in 2024 a total of ~123K units are produced.
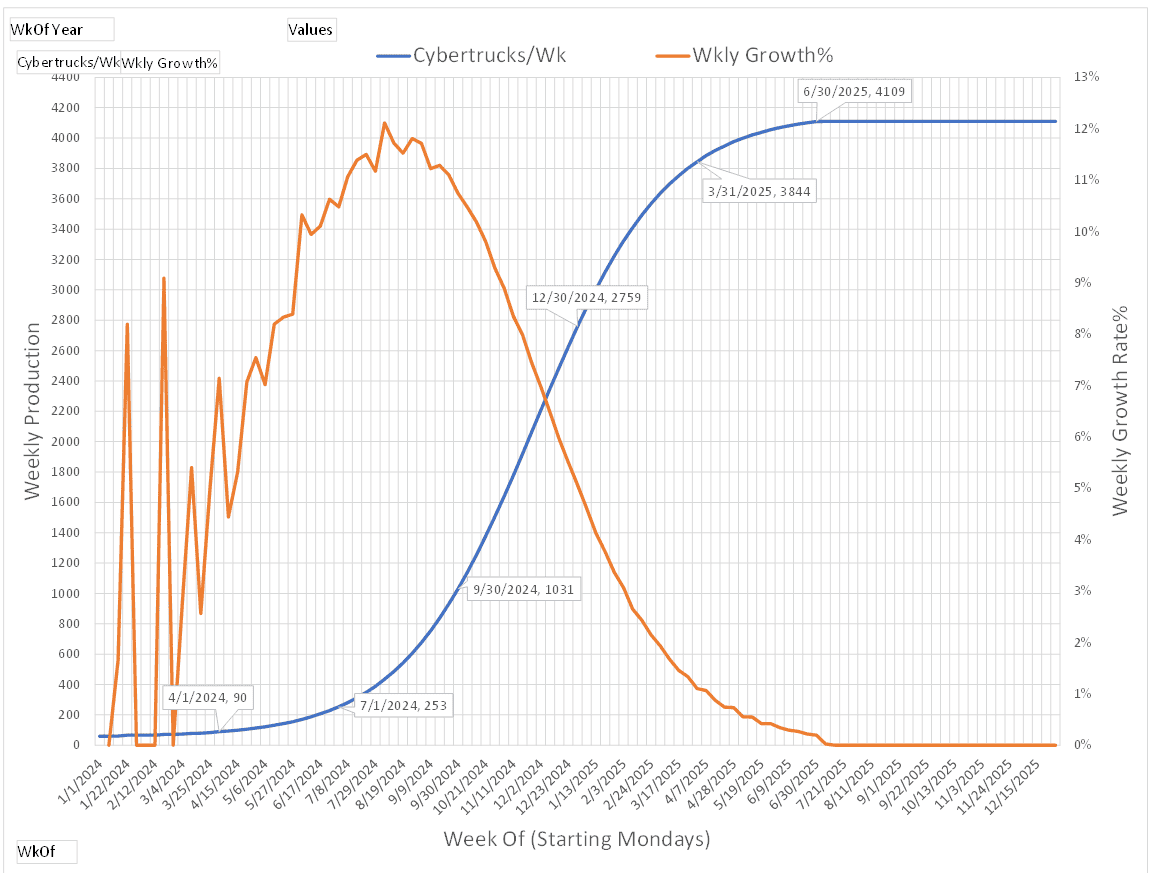
This is just one scenario assuming just one simple s-curve model, basically linear, to approximate how the ramp progresses. A more detailed outcome would require more s-curve analysis for the ramp-up phase.
Beyond me. Hopefully not you.
other key assumptions:
In all, I was surprised to find that based on these assumptions, Musk’s claim that ~18mo from now would be when the line hits maximum capacity, results in a ramp during 2024 that results in ~125K total units being built in 2024 (matching the daily run rate target to be hit sometime in 2024). However, based on this model (specifically the S-curve assumed), this scenario would have ramp achieving a run rate of 335 units/day (the 125k/year inflection point), not during 2024, but instead mid-February 2025.
For the model to assume that the 335 units/day would occur in 2024, Dec. must contain that date (or else the max run rate of 670 units/day occurs in 2024, contrary to the stated expectation).
If the inflection point is reached on December 1, 2024 (which is halfway through the ramp-up), then (based on the S-curve assumed) it would take only an additional month from that date to reach the maximum rate of 670 units/day, by approximately mid-January 1, 2025.
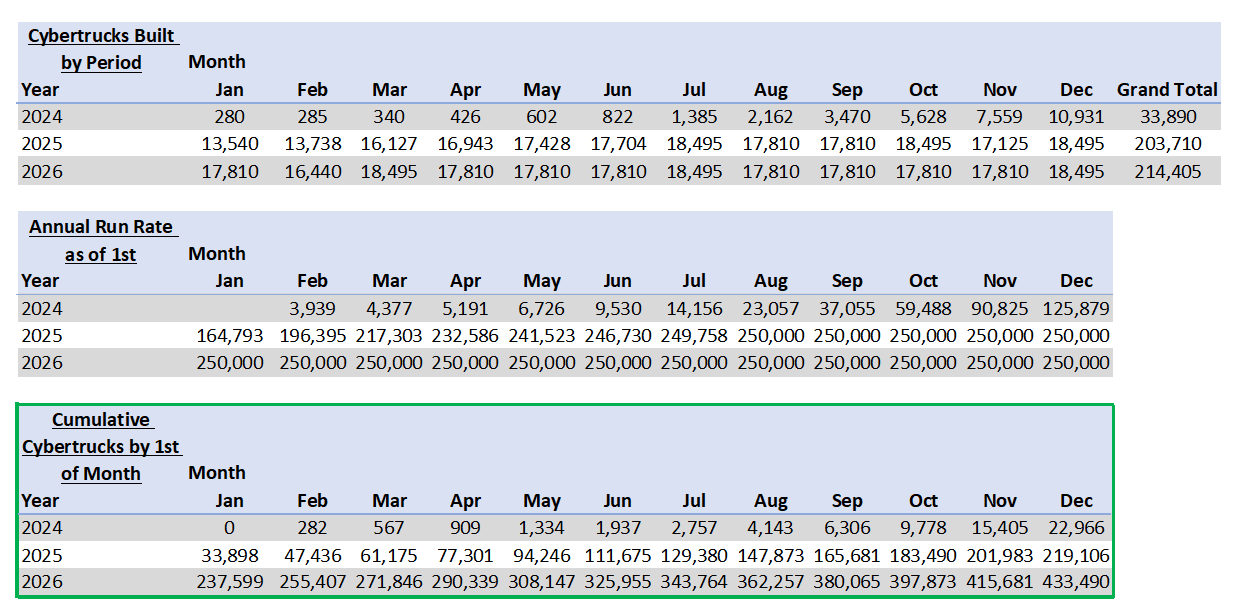
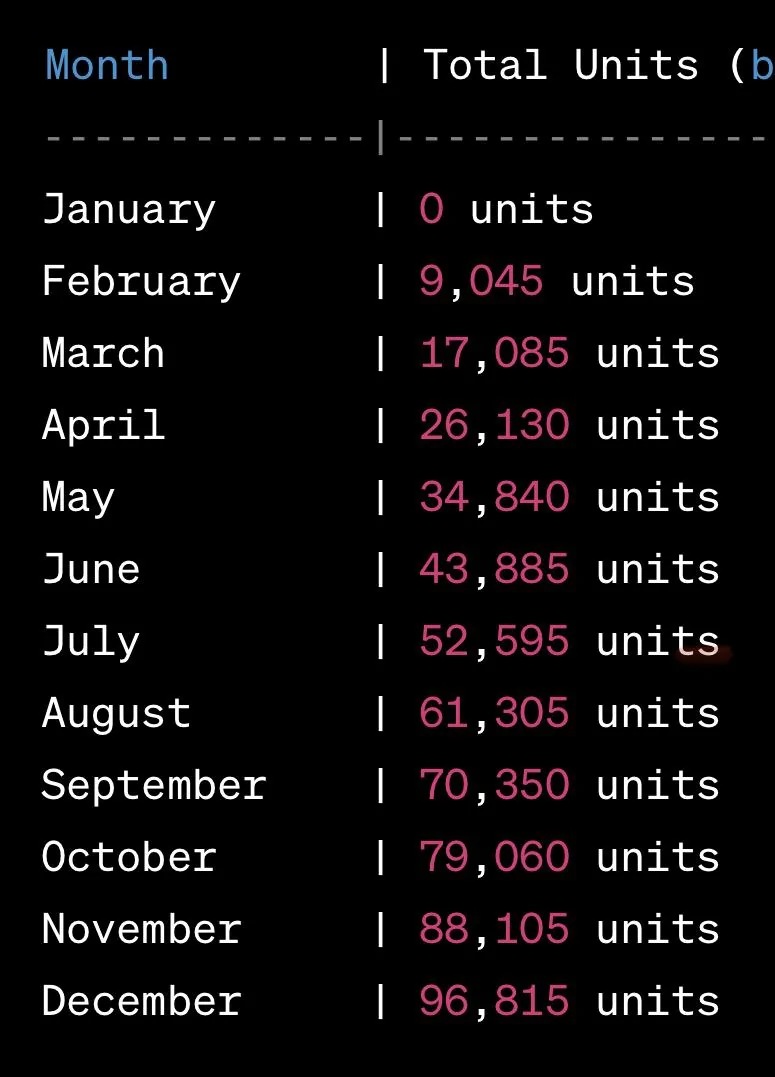
Under this scenario, here’s how many CT’s would be produced total at each point of the 1st of each month through 2024 (calculated as of the 1st of each month)

Better math folks out there?
So I did the ham-fisted job below, to send those smarter folks into a “you’ve done it wrong” rage, and compel them to make a better analysis.
so please correct me to death!
here’s my question and attempt;
I’d like to know how many CTs might be built total, at each 1st of the month during 2024 - assuming the ramp hits a maximum run rate of 225K/year sometime in 2025, and a mid ramp inflection point 125K/yr run rate sometime during 2024.
In the Q3 call, Musk said that for 2024 they are targeting hitting a run rate of 125,000 units. That ~means only, that at some point in 2024 they will begin to average ~335 units built / day.
If they reach that daily run rate only on the last day of 2024, they will build a lot less than 125K total trucks over the calendar year 2024.
That being only an extreme example to make the point that how many total Cybertrucks are built of CY 2024 depends when during the year they reach a maximum daily run rate of 335s. Even in that example, the exact number of units built depends on what, exactly, “S-cur ve” (as Musk mentions but never details) there is in the ramp period (between Jan 1 ‘24 and the date they hit the target run rate).
Because we know that Tesla’s ultimate target is a run rate of 250K sometime in 2025 (670 units / day), we can’t determine how many CTs might be built in CY 2024 without letting the ramp continue upwards after they hit the 125K run rate, through to when they hit the eventual max 250K run rate (which is the capacity limit of the existing line).
Under this model, and curious about the number of CTs that might be built in 2024 (or 2025 for that matter), I did some back-of-napkin math (ie OpenAI).
For simplicity, I looked at only the hypos where the daily max run rate max of 250K was achieved on either Jan. 1st ‘25 (the most optimistic scenario), or the first of each next month, through to Dec. 1st ‘25 (the least optimistic scenario).
In the most optimistic scenario (max run rate of 670 units/day is achieved on Jan. 1, 2025) it would mean ~135K CTs are built in 2024 total. In the most pessimistic scenario (max run rate of 670 units/day isn’t achieved until Dec. 1, 2025) ~91K CTs are built in 2024 total.
If we instead take Musk’s comments regarding ‘18 months from now’ as the relevant point of reach 670 units/day, that would be April 2025, in which case in 2024 a total of ~123K units are produced.
This is just one scenario assuming just one simple s-curve model, basically linear, to approximate how the ramp progresses. A more detailed outcome would require more s-curve analysis for the ramp-up phase.
Beyond me. Hopefully not you.
other key assumptions:
- Jan. 1 2024 ramp starts with 10 units.
- The average production during the phase is taken as the midpoint between the starting production and max capacity (335 units/day).
- Once the max capacity is reached, production is a constant 670 units/day,
- No builds occur on Saturdays (to approximate downtime on the line).
- Each month has roughly 4 Saturdays, leading to 4 non-production days per month.
In all, I was surprised to find that based on these assumptions, Musk’s claim that ~18mo from now would be when the line hits maximum capacity, results in a ramp during 2024 that results in ~125K total units being built in 2024 (matching the daily run rate target to be hit sometime in 2024). However, based on this model (specifically the S-curve assumed), this scenario would have ramp achieving a run rate of 335 units/day (the 125k/year inflection point), not during 2024, but instead mid-February 2025.
For the model to assume that the 335 units/day would occur in 2024, Dec. must contain that date (or else the max run rate of 670 units/day occurs in 2024, contrary to the stated expectation).
If the inflection point is reached on December 1, 2024 (which is halfway through the ramp-up), then (based on the S-curve assumed) it would take only an additional month from that date to reach the maximum rate of 670 units/day, by approximately mid-January 1, 2025.
Under this scenario, here’s how many CT’s would be produced total at each point of the 1st of each month through 2024 (calculated as of the 1st of each month)
Better math folks out there?
Sponsored
") ?
?