cvalue13
Well-known member
- Joined
- Aug 17, 2022
- Threads
- 74
- Messages
- 7,153
- Reaction score
- 13,769
- Location
- Austin, TX
- Vehicles
- F150L
- Occupation
- Fun-employed
the CAPEX chart is both interesting and misleading.This was interesting.

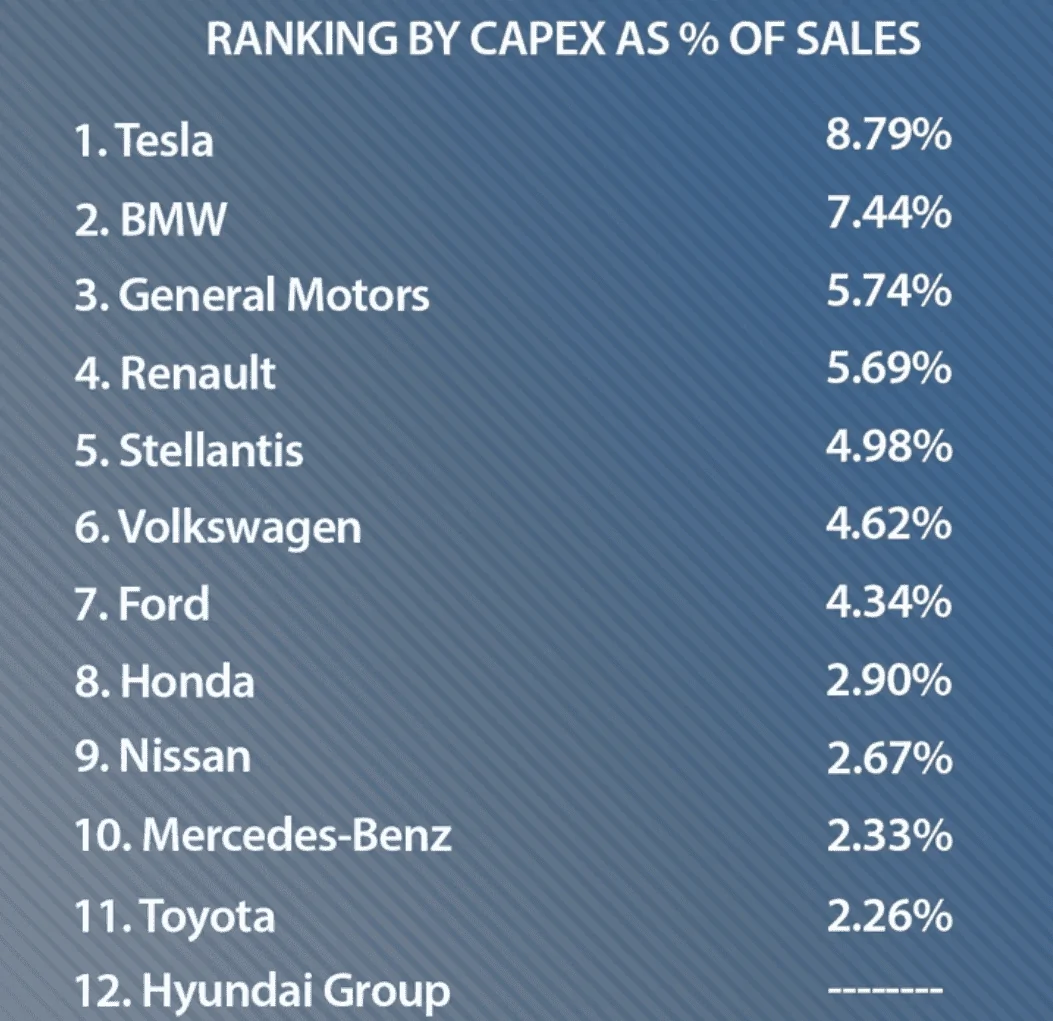
it’s interesting in that Tesla’s CAPEX reflects their omnichannel sales and service model, ‘owning’ the sales chain all the way to the customer. Conversely the other legacies of course have their dealership model, and - where the sales and service chain is concerned - expend little CAPEX past delivery to dealerships.
That said, the same thing that is mislead is also what’s interesting: at a cartoon level, this chart shows where Tesla’s omnichannel approach pays out from its higher margins. It’s per vehicle margins are higher because it doesn’t share margin with the “middle man” - but they incur significant CAPEX to be the middleman.
And as both their product and geographic range increases, those CAPEX amounts will increase as a percentage of sales.
Thanks for sharing the link - it puts some numbers to a repetitive theme in the forum.
Sponsored