TruckElectric
Well-known member
- First Name
- Bryan
- Joined
- Jun 16, 2020
- Threads
- 772
- Messages
- 2,488
- Reaction score
- 3,280
- Location
- Texas
- Vehicles
- Dodge Ram diesel
- Occupation
- Retired
- Thread starter
- #1
At a V3 Supercharger, it charges at 250 kW from 10% to 30% SOC.
Today we will take a look at the fast charging results of the brand new Tesla Model SPlaid that is expected to offer the best charging curve of any Tesla car so far.
One of the first Plaid cars on the road was recently tested at a V3 Supercharging station (250 kW) by MotorTrend, which allows us to analyze the performance and see whether there is a room for improvements.
According to the article, the test was conducted after preconditioning the battery and at an ambient temperature of 71°F (21°C).
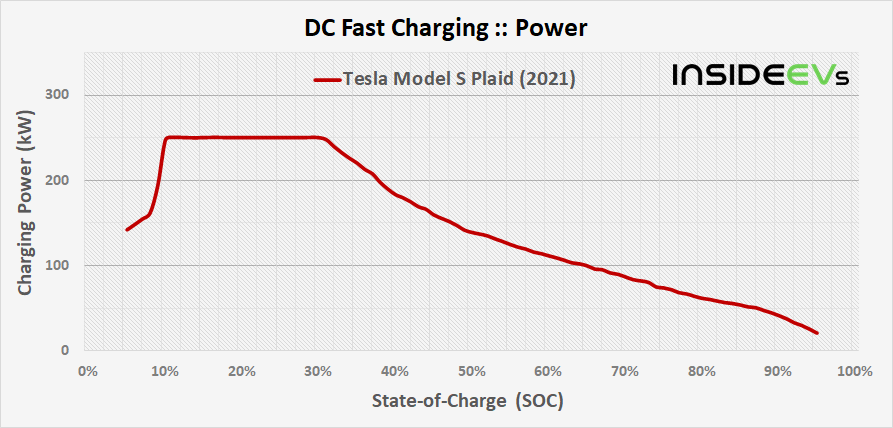
Charging power vs state-of-charge (SOC)
The charging curve, while charging from 5% SOC to 95% SOC looks very good. After a while, power output quickly increases to the maximum of 250 kW at around 10% SOC, where it stays up to around 30% SOC. That's a really nice sight.
We guess that the peak charging rate is limited by the station, not by the car, and at least for a short period, the battery would be willing to accept more.
After 30% SOC, the power output gradually and very smoothly decreases, reaching 50 kW at about 87% SOC. Again, not bad.

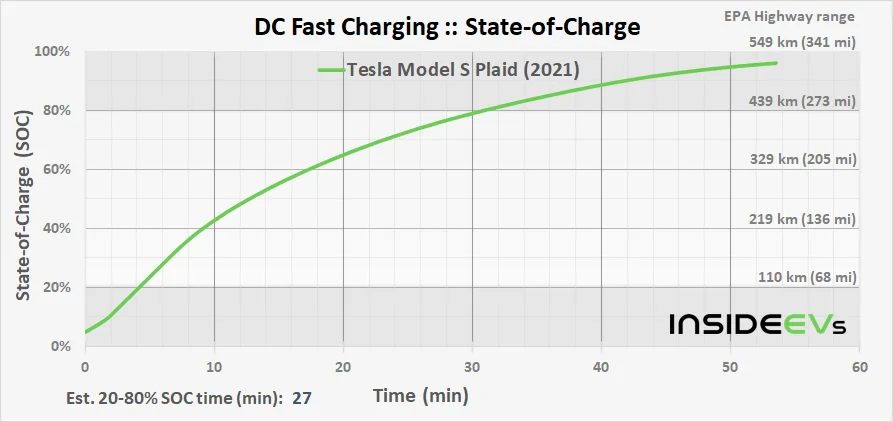
State-of-charge (SOC) vs time
According to the article, the 5-95% SOC session took about 52 minutes. As MotorTrendprovides only a handful of data points, we did our best to estimate the time.
The estimated time from 20% to 80% SOC is about 27 minutes. Starting at 10% SOC would require 29 minutes.
Tesla says that 15 minutes should be enough to replenish 187 miles (301 km) of range and the data indicates very close results in narrow optimum charging window (if we apply EPA Highway range for the Plaid). We guess that it will probably easily be possible in a Model S Long Range with 19" wheels (noticeably higher EPA result).
According to the data, about 100 miles can be recharged in 7 minutes (10-40% SOC).
The chart below is only for illustrative purposes:

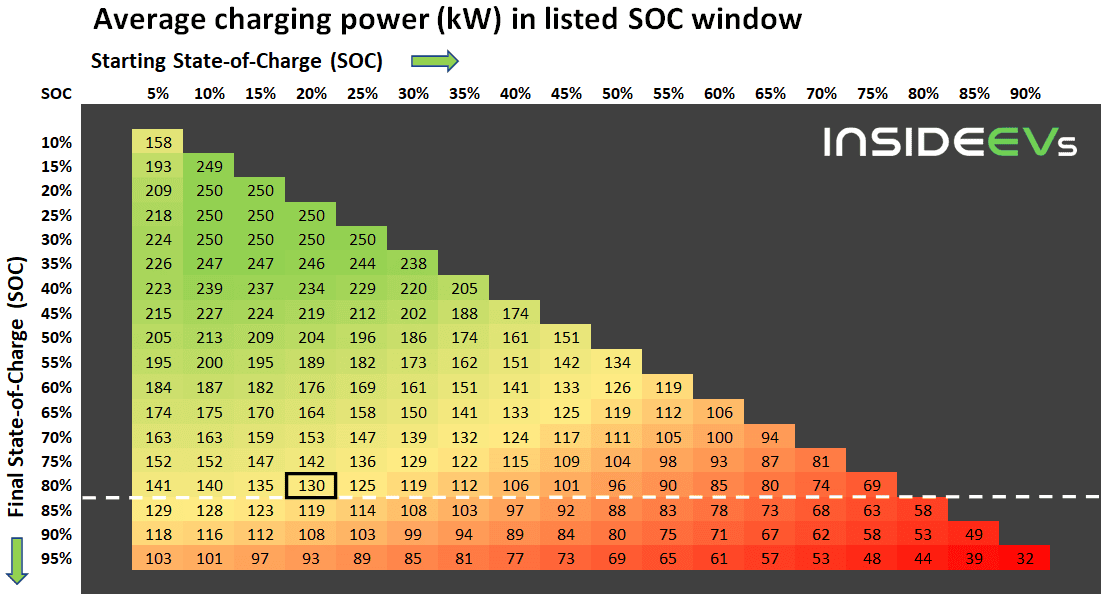
Average charging power vs state-of-charge (SOC)
The average power in the very important range from 20% to 80% SOC is 130 kW, which is 52% of the peak value. That's probably the highest value that we saw so far in a Tesla, but it's normal as the Model S has the highest battery capacity (compared to Model 3 Long Range).

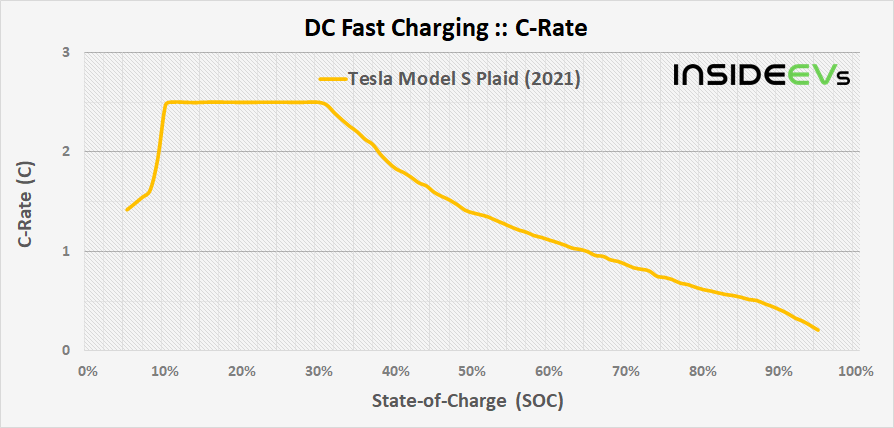
C-rate vs state-of-charge (SOC)
The peak C-rate* - charging power in relation to the total battery capacity of 100 kWh (just a guess) - is about 2.5C.
The average C-rate when charging from 20% to 80% SOC is 1.3C.
*C-rate tells us how the charging power relates to the battery pack capacity. For example: 1C is 1-hour charging power (current), when the power value in kW is equal to the battery pack capacity in kWh. 2C would be enough to recharge in half an hour.
The net battery capacity indicated in the article is 96.7 kWh, which would be about 97% of the total battery capacity.

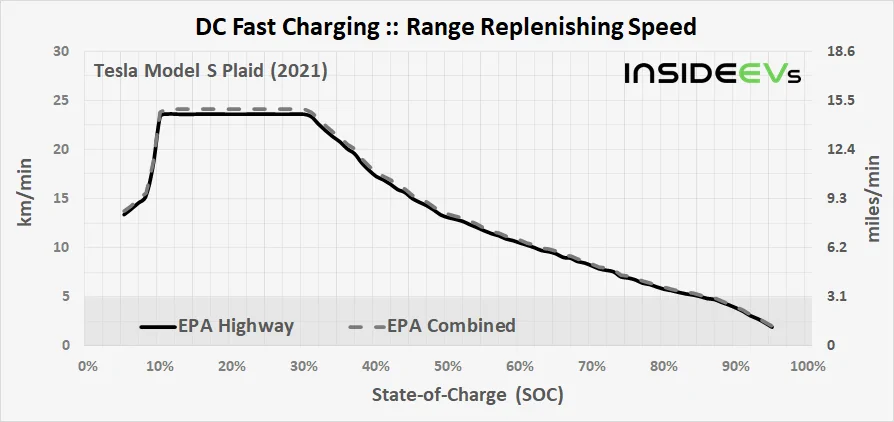
Range replenishing speed vs state-of-charge (SOC)
The rate of range replenishing depends on the energy consumption and the energy consumption depends on the use case. In the case of Model S Plaid with 21" wheels, we have official EPA numbers:

Ultimate DC fast charging card
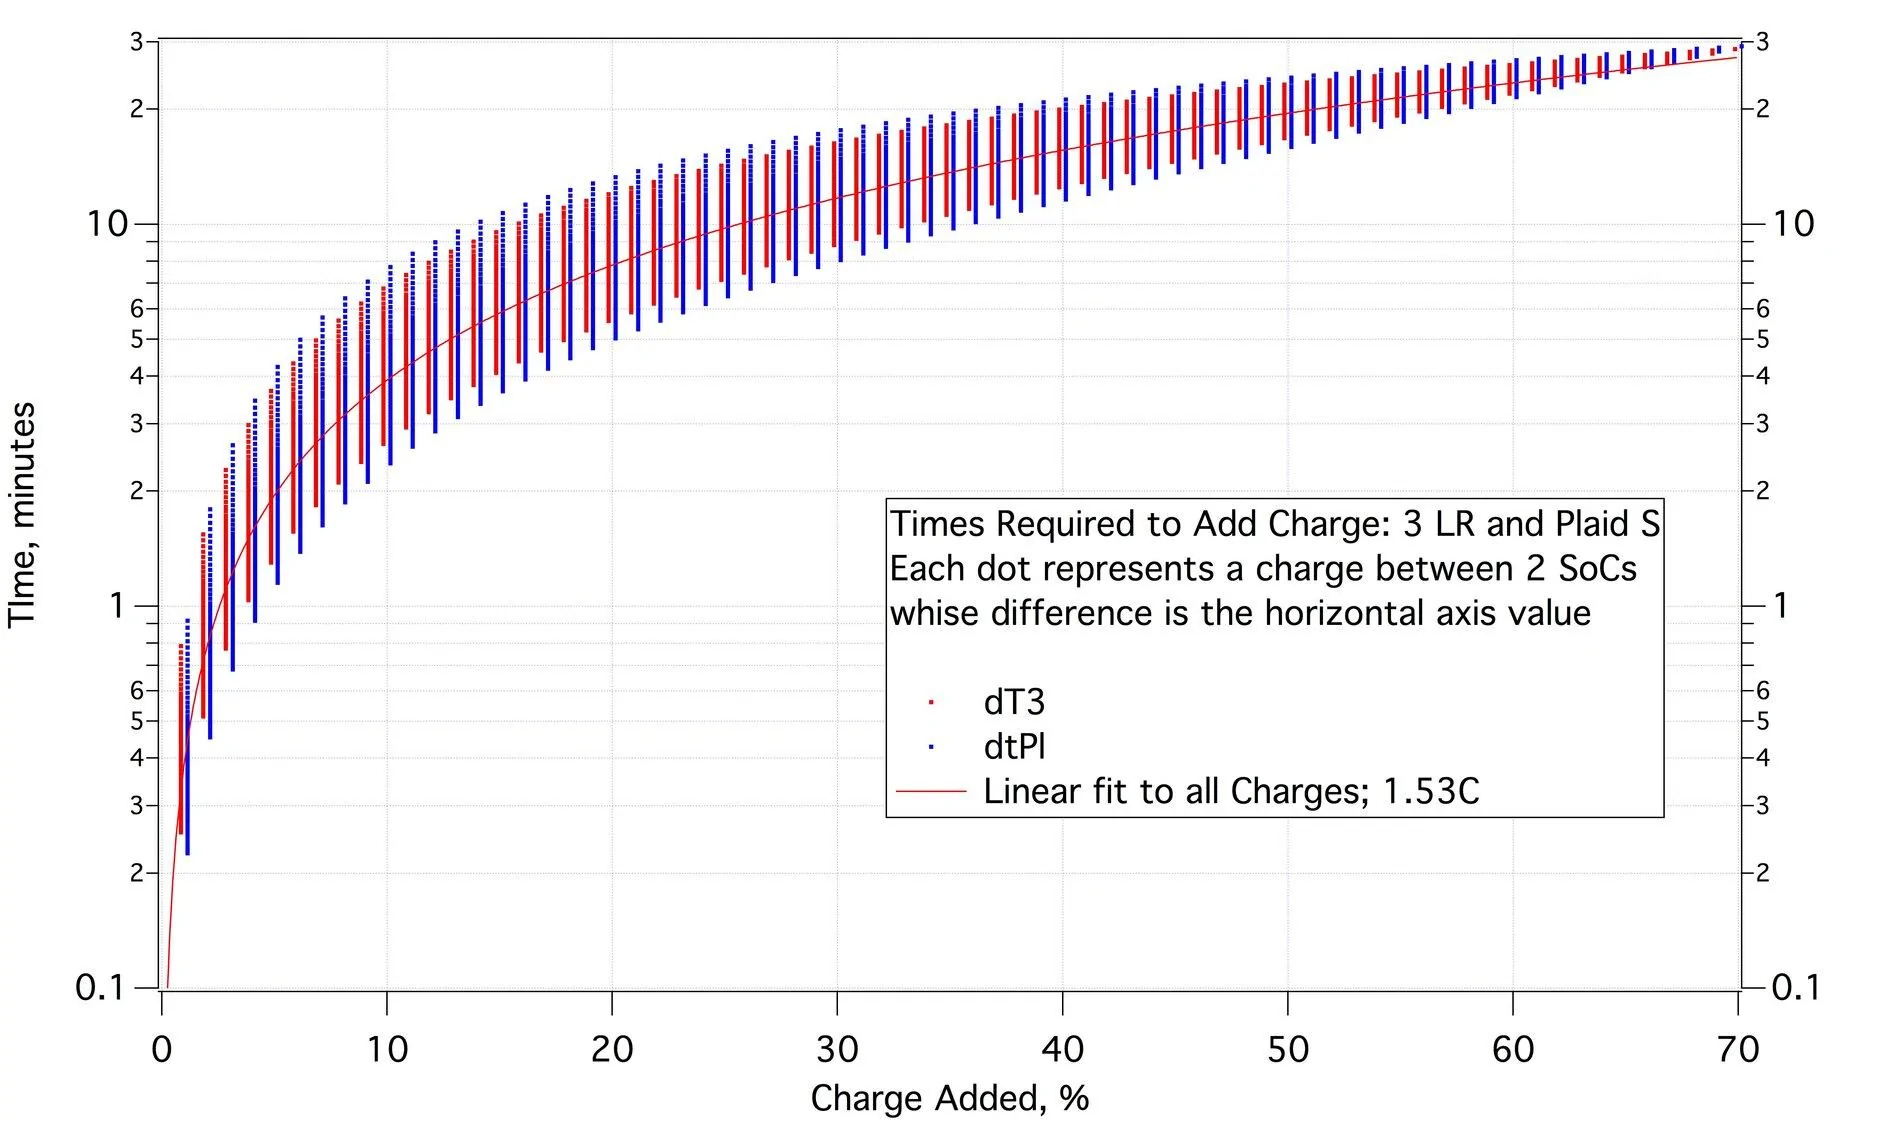
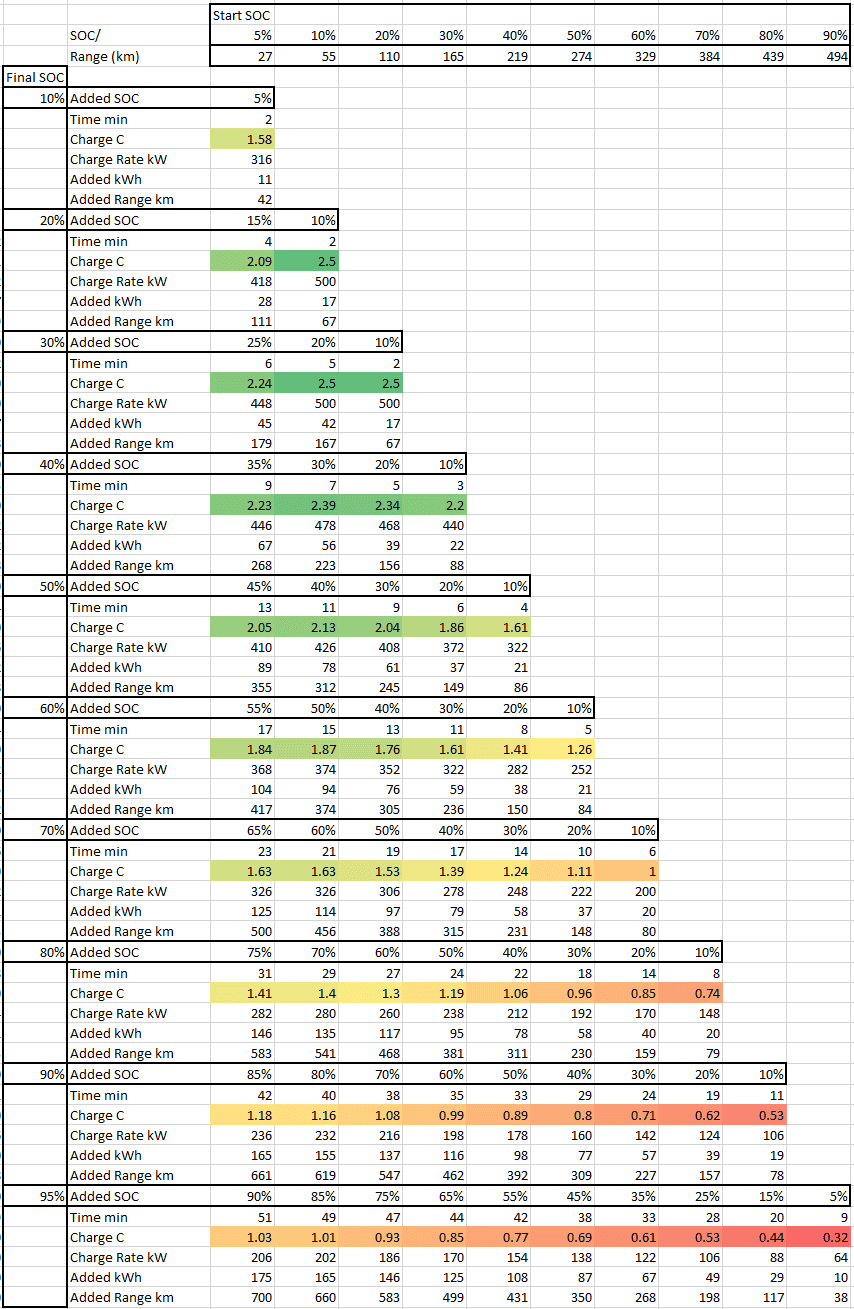
Here is our ultimate charging card for the Tesla Model S Plaid (2021) that shows the estimated time of charging to add a certain number of SOC percent points, average charging power, added energy and added range for listed SOC ranges. Click here to enlarge the image.

The matrix above, might be helpful from the user perspective, but be aware that it's just an estimate from a particular test, with measure and calculation uncertainty probably above 5%. On top of that comes variation for individual case - car (version, age/battery state-of-health), charger, ambient and battery temperature, software version and more (including cabin heating/cooling during charging). Another thing is that the charging curve might shift when charging starts at a lower/higher SOC.
Now let's take a look at the Plaid against some other models like the Tesla Model 3, tested by InsideEVs' Tom Moloughney, and Hyundai Ioniq 5 tested in Europe by Battery Life.
Comparison of charging power
If we look at the charging curve, we can see that the new Model S appears to be much more capable than the Model 3 Long Range. Hyundai Ioniq 5 has a completely different charging curve.

The average power in the 20-80% SOC window at 130 kW is much better than in the case of the Model 3 Long Range:
Comparison of State-of-charge (SOC) vs time
The charging time of the new Model S in the 20-80% SOC window (estimated at 27 minutes) probably is slightly longer than in the case of the Model 3 Long Range (24-26 minutes).
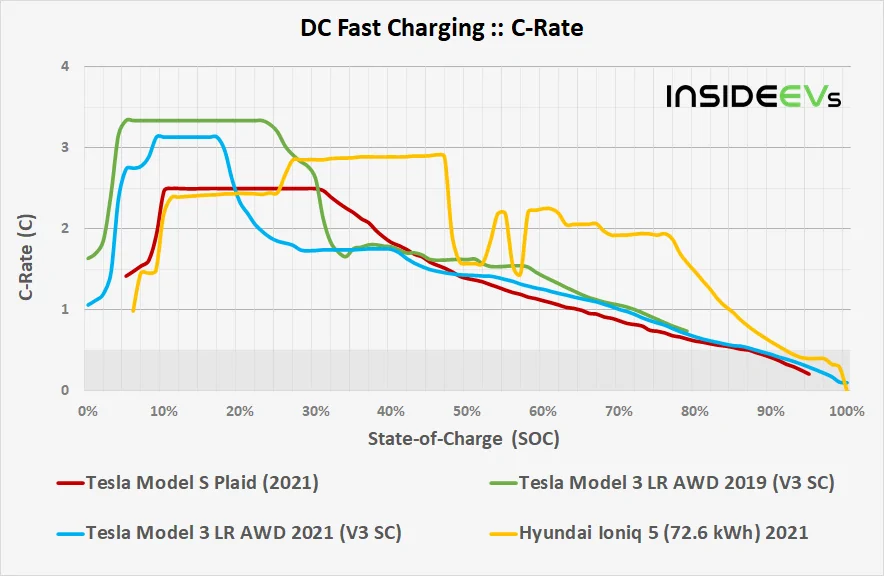
Comparison of C-rate
An interesting thing is the C-rate chart, as it reveals that the battery in the new Model S is not under as high a peak load as in the Model 3 Long Range.
Model S uses cylindrical 18650-type cells, while the Model 3/Y uses newer 2170-type, which might be one of the reasons.
The other reason is that the new Model S is limited by the station/software and clearly could go higher than 250 kW. At 300 kW, it would be in the 3C club as well.

A little bit of summary:
Comparison of range replenishing speed
The new Model S replenishes range very quickly. The peak rate is not as high as in the case of the more efficient Model 3, but it's very quick.
We applied the same charging results to the Model S Long Range AWD, which has a noticeably higher EPA range and a higher range replenishing rate.

Actually, the average in the 20-80% SOC window is better in the Tesla Model S Long Range AWD than in the Model 3 that we analyzed before. Because the tests are affected by many factors, we would say that it's comparable.
Of course, the Hyundai Ioniq 5 is offering the best rate of all EVs tested so far:
Conclusions
It was the first fast-charging test of the all-new 2021 Tesla Model S Plaid that we analyzed so far and the results are not only very good, but also promising for the future.
The peak charging power is available for several minutes (10-30% SOC), the average of 130 kW is good, and the charging time, from 5-80% in 31 minutes, is impressive. The new Model S has potential to charge at even higher peak power levels in the future.
On the other hand, it seems that the upgraded battery system in Tesla's flagship will not be able to match Hyundai Motor Group's E-GMP platform. Long range and availability of the Supercharging network more than outweigh this difference, which makes the new Model S still the top choice for long-distance travel.
General info:
* Some values on the charts are estimated from the data source.
** Temperature of the battery cells might highly negatively affect charging capabilities. We don't have data about temperatures of the battery at the beginning and during the charging process. In cold or hot weather, as well as after driving very dynamically, charging power might be significantly lower than shown on the charts (in extreme cases charging might be impossible until the battery temperature will not return to an acceptable level).
Tesla Model S Plaid specs
SOURCE: INSIDEEVs
Today we will take a look at the fast charging results of the brand new Tesla Model SPlaid that is expected to offer the best charging curve of any Tesla car so far.
One of the first Plaid cars on the road was recently tested at a V3 Supercharging station (250 kW) by MotorTrend, which allows us to analyze the performance and see whether there is a room for improvements.
According to the article, the test was conducted after preconditioning the battery and at an ambient temperature of 71°F (21°C).
Charging power vs state-of-charge (SOC)
The charging curve, while charging from 5% SOC to 95% SOC looks very good. After a while, power output quickly increases to the maximum of 250 kW at around 10% SOC, where it stays up to around 30% SOC. That's a really nice sight.
We guess that the peak charging rate is limited by the station, not by the car, and at least for a short period, the battery would be willing to accept more.
After 30% SOC, the power output gradually and very smoothly decreases, reaching 50 kW at about 87% SOC. Again, not bad.
State-of-charge (SOC) vs time
According to the article, the 5-95% SOC session took about 52 minutes. As MotorTrendprovides only a handful of data points, we did our best to estimate the time.
The estimated time from 20% to 80% SOC is about 27 minutes. Starting at 10% SOC would require 29 minutes.
Tesla says that 15 minutes should be enough to replenish 187 miles (301 km) of range and the data indicates very close results in narrow optimum charging window (if we apply EPA Highway range for the Plaid). We guess that it will probably easily be possible in a Model S Long Range with 19" wheels (noticeably higher EPA result).
According to the data, about 100 miles can be recharged in 7 minutes (10-40% SOC).
The chart below is only for illustrative purposes:
Average charging power vs state-of-charge (SOC)
The average power in the very important range from 20% to 80% SOC is 130 kW, which is 52% of the peak value. That's probably the highest value that we saw so far in a Tesla, but it's normal as the Model S has the highest battery capacity (compared to Model 3 Long Range).
C-rate vs state-of-charge (SOC)
The peak C-rate* - charging power in relation to the total battery capacity of 100 kWh (just a guess) - is about 2.5C.
The average C-rate when charging from 20% to 80% SOC is 1.3C.
*C-rate tells us how the charging power relates to the battery pack capacity. For example: 1C is 1-hour charging power (current), when the power value in kW is equal to the battery pack capacity in kWh. 2C would be enough to recharge in half an hour.
The net battery capacity indicated in the article is 96.7 kWh, which would be about 97% of the total battery capacity.
Range replenishing speed vs state-of-charge (SOC)
The rate of range replenishing depends on the energy consumption and the energy consumption depends on the use case. In the case of Model S Plaid with 21" wheels, we have official EPA numbers:
- EPA Combined range
Taking into consideration the EPA Combined range of 348 miles (560 km) and available battery capacity of 96.7 kWh, we can assume energy consumption of 278 Wh/mile (173 Wh/km). The effective average speed of range replenishing when charging from 20% to 80% SOC would be 7.8 miles/minute (12.5 km/minute). - EPA Highway range
Taking into consideration the EPA Highway range of 341 miles (549 km) and available battery capacity of 96.7 kWh, we can assume energy consumption of 284 Wh/mile (176 Wh/km).
The effective average speed of range replenishing when charging from 20% to 80% SOC would be 7.6 miles/minute (12.3 km/minute).
Ultimate DC fast charging card
Here is our ultimate charging card for the Tesla Model S Plaid (2021) that shows the estimated time of charging to add a certain number of SOC percent points, average charging power, added energy and added range for listed SOC ranges. Click here to enlarge the image.
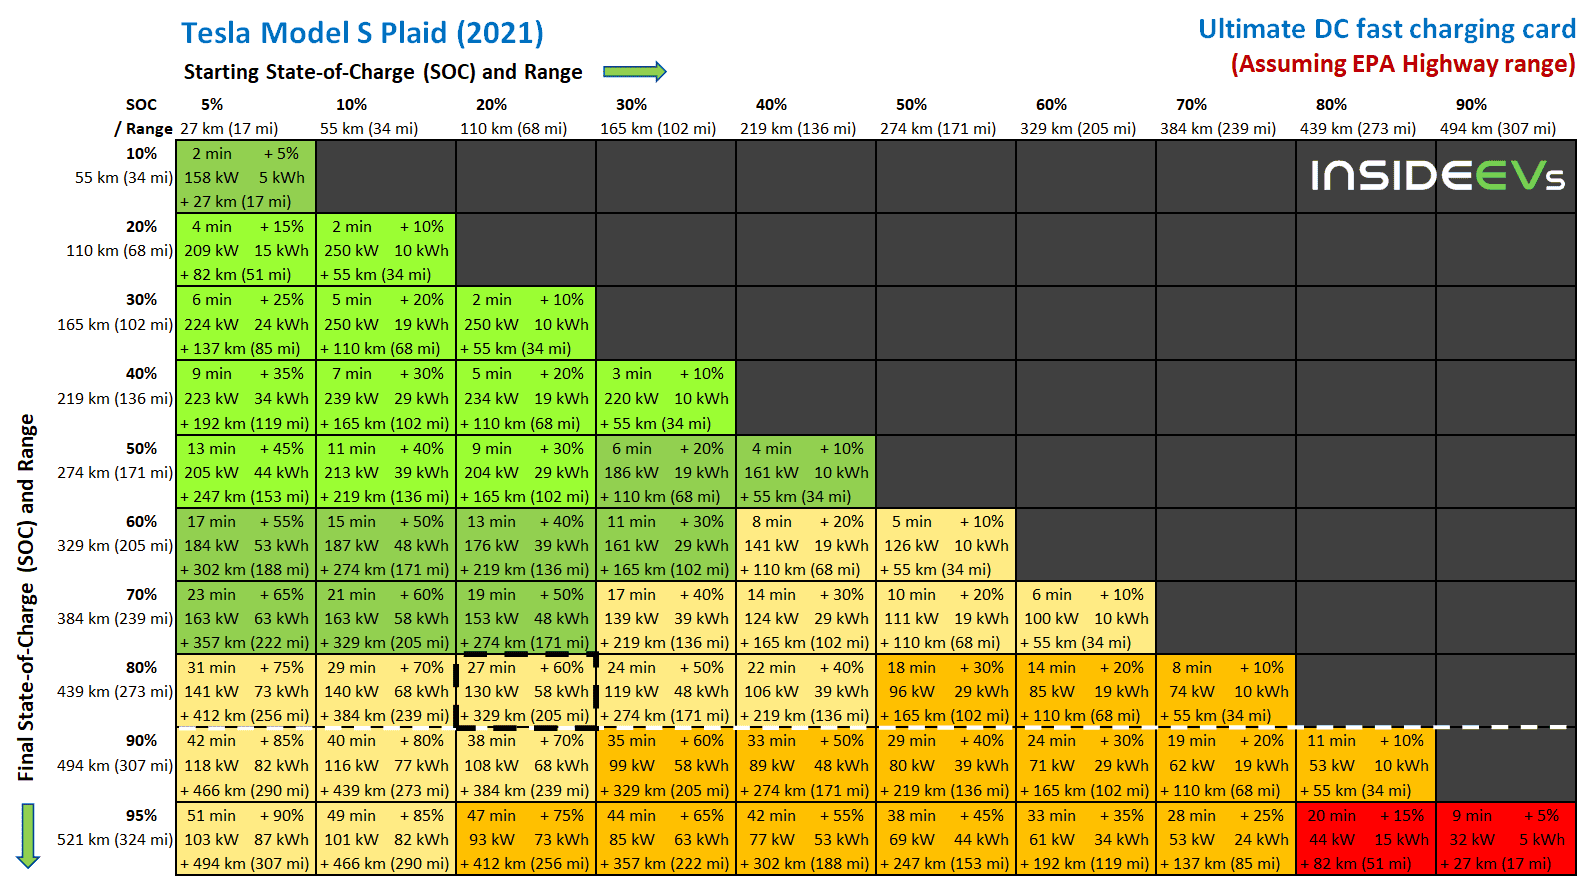
The matrix above, might be helpful from the user perspective, but be aware that it's just an estimate from a particular test, with measure and calculation uncertainty probably above 5%. On top of that comes variation for individual case - car (version, age/battery state-of-health), charger, ambient and battery temperature, software version and more (including cabin heating/cooling during charging). Another thing is that the charging curve might shift when charging starts at a lower/higher SOC.
Now let's take a look at the Plaid against some other models like the Tesla Model 3, tested by InsideEVs' Tom Moloughney, and Hyundai Ioniq 5 tested in Europe by Battery Life.
Comparison of charging power
If we look at the charging curve, we can see that the new Model S appears to be much more capable than the Model 3 Long Range. Hyundai Ioniq 5 has a completely different charging curve.
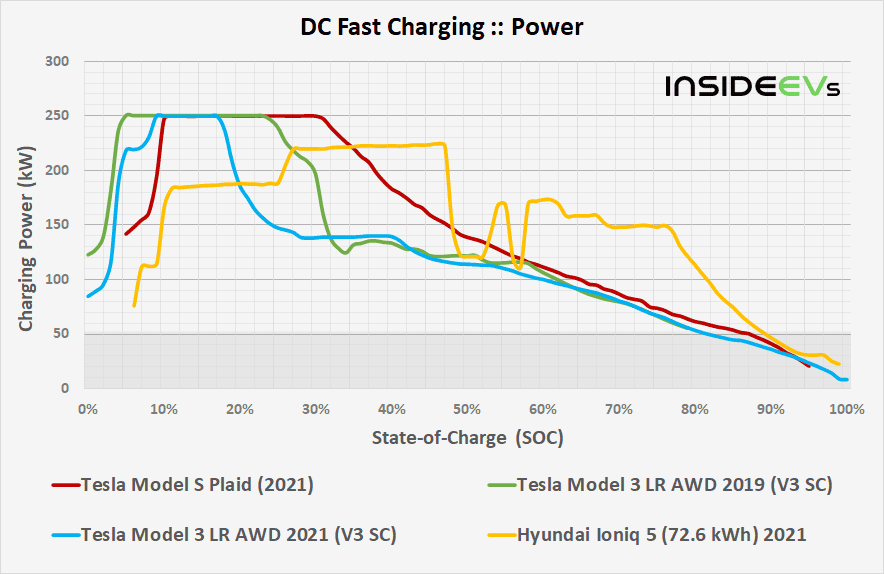
The average power in the 20-80% SOC window at 130 kW is much better than in the case of the Model 3 Long Range:
| DC Fast Charging Comparison by InsideEVs | |||
| Model [data source] | Drive / Battery (kWh) | Max Power | Avg Power (20-80%) |
| 2021 Tesla Model S Plaid [MotorTrend] | AWD 100 kWh | 250 kW | 130 kW |
| 2021 Tesla Model 3 LR AWD (V3 SC) [Tom Moloughney] | AWD 80 kWh | 250 kW | 106 kW |
| 2019 Tesla Model 3 LR AWD (V3 SC) [Tom Moloughney] | AWD 75 kWh | 250 kW | 113 kW |
| 2021 Hyundai Ioniq 5 (72.6 kWh) [Battery Life] | AWD 77 kWh | 224 kW | 170 kW |
The charging time of the new Model S in the 20-80% SOC window (estimated at 27 minutes) probably is slightly longer than in the case of the Model 3 Long Range (24-26 minutes).
Comparison of C-rate
An interesting thing is the C-rate chart, as it reveals that the battery in the new Model S is not under as high a peak load as in the Model 3 Long Range.
Model S uses cylindrical 18650-type cells, while the Model 3/Y uses newer 2170-type, which might be one of the reasons.
The other reason is that the new Model S is limited by the station/software and clearly could go higher than 250 kW. At 300 kW, it would be in the 3C club as well.
A little bit of summary:
| DC Fast Charging Comparison by InsideEVs | ||||||
| Model [data source] | Drive / Battery (kWh) | Max Power | Avg Power (20-80%) | Max C-Rate | Avg C-Rate (20-80%) | Time (20-80%) |
| 2021 Tesla Model S Plaid [MotorTrend] | AWD 100 kWh | 250 kW | 130 kW | 2.5 | 1.3 | 27 min |
| 2021 Tesla Model S Long Range AWD* [MotorTrend] | AWD 100 kWh | 250 kW | 130 kW | 2.5 | 1.3 | 27 min |
| 2021 Tesla Model 3 LR AWD (V3 SC) [Tom Moloughney] | AWD 80 kWh | 250 kW | 106 kW | 3.1 | 1.3 | 26 min |
| 2019 Tesla Model 3 LR AWD (V3 SC) [Tom Moloughney] | AWD 75 kWh | 250 kW | 113 kW | 3.3 | 1.5 | 24 min |
| 2021 Hyundai Ioniq 5 (72.6 kWh) [Battery Life] | AWD 77 kWh | 224 kW | 170 kW | 2.9 | 2.2 | 15 min |
The new Model S replenishes range very quickly. The peak rate is not as high as in the case of the more efficient Model 3, but it's very quick.
We applied the same charging results to the Model S Long Range AWD, which has a noticeably higher EPA range and a higher range replenishing rate.
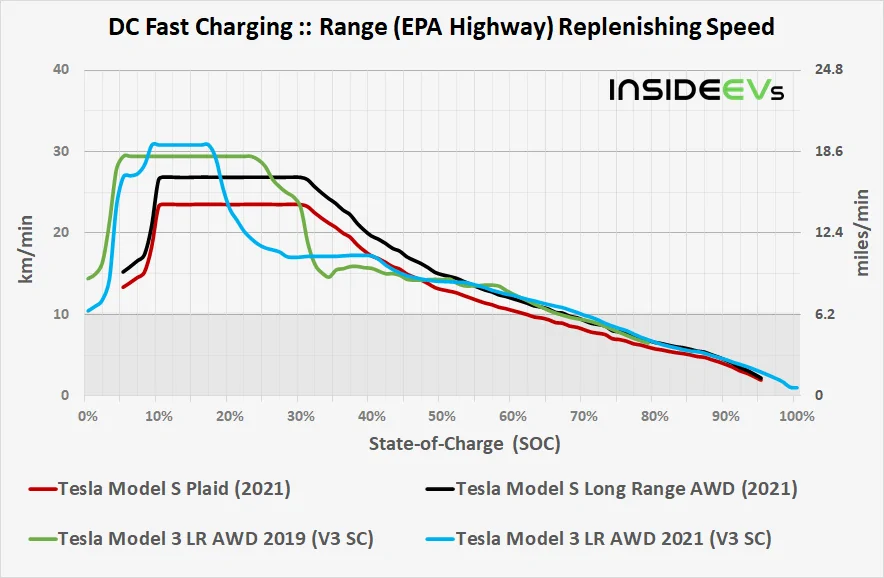
Actually, the average in the 20-80% SOC window is better in the Tesla Model S Long Range AWD than in the Model 3 that we analyzed before. Because the tests are affected by many factors, we would say that it's comparable.
Of course, the Hyundai Ioniq 5 is offering the best rate of all EVs tested so far:
| DC Fast Charging Comparison by InsideEVs | ||||
| Model [data source] | Drive / Battery (kWh) | Avg Power (20-80%) | WLTP range rep. rate (20-80%) | EPA Hgw range rep. rate (20-80%) |
| 2021 Tesla Model S Plaid [MotorTrend] | AWD 100 kWh | 130 kW | 12.3 km/min (7.6 mi/min) | |
| 2021 Tesla Model S Long Range AWD* [MotorTrend] | AWD 100 kWh | 130 kW | 14 km/min (8.7 mi/min) | |
| 2021 Tesla Model 3 LR AWD (V3 SC) [Tom Moloughney] | AWD 80 kWh | 106 kW | 14.9 km/min 9.3 mi/min | 13 km/min (8.1 mi/min) |
| 2019 Tesla Model 3 LR AWD (V3 SC) [Tom Moloughney] | AWD 75 kWh | 113 kW | 15.6 km/min 9.7 mi/min | 13.4 km/min (8.3 mi/min) |
| 2021 Hyundai Ioniq 5 (72.6 kWh) [Battery Life] | AWD 77 kWh | 170 kW | 18.8 km/min 11.7 mi/min |
It was the first fast-charging test of the all-new 2021 Tesla Model S Plaid that we analyzed so far and the results are not only very good, but also promising for the future.
The peak charging power is available for several minutes (10-30% SOC), the average of 130 kW is good, and the charging time, from 5-80% in 31 minutes, is impressive. The new Model S has potential to charge at even higher peak power levels in the future.
On the other hand, it seems that the upgraded battery system in Tesla's flagship will not be able to match Hyundai Motor Group's E-GMP platform. Long range and availability of the Supercharging network more than outweigh this difference, which makes the new Model S still the top choice for long-distance travel.
| 2021 Tesla Model S Plaid :: DC Fast Charging Summary by InsideEVs Drive: AWD; Battery pack (net / total): 96.7 / 100 kWh [Data source: MotorTrend] | |
| Peak Power Peak C-rate Average Power (20-80% SOC) Average-to-Peak Power Average C-rate (20-80% SOC) Time (20-80% SOC) | 250 kW 2.5 130 kW 52% 1.3 27 min |
| Range Replenishing Speed (Average 20-80% SOC): | |
| EPA Combined EPA Highway | 12.5 km/min (7.8 mi/min) 12.3 km/min (7.6 mi/min) |
General info:
* Some values on the charts are estimated from the data source.
** Temperature of the battery cells might highly negatively affect charging capabilities. We don't have data about temperatures of the battery at the beginning and during the charging process. In cold or hot weather, as well as after driving very dynamically, charging power might be significantly lower than shown on the charts (in extreme cases charging might be impossible until the battery temperature will not return to an acceptable level).
Tesla Model S Plaid specs
- 390 miles (628 km) of EPA est. range
- battery capacity: N/A
- 0-60 mph (96.5 km/h) in 1.99 seconds (*with rollout subtracted)
0-100 km/h (62 mph) in 2.1 seconds (*with rollout subtracted)
MotorTrend's 0-60 mph (asphalt, no rollout): 2.28 seconds - 1/4 mile 9.23 seconds at 155 mph trap speed
Jay Leno's 1/4 mile record of 9.247 seconds at 152.16 mph trap speed - top speed of 200 mph (322 km) †when equipped with the proper wheels and tires (available fall 2021)
- three-motor all-wheel drive (one motor in the front and two motors in the rear)
- system output: 1,020 hp (about 760 kW)
- DC fast charging: at up to 250 kW (Superchargers)
can replenish 187 miles (301 km) in 15 minutes - Drag Coefficient 0.208 Cd
- Wheels 19" or 21"
- Cargo 28 cu ft
- Weight 4,766 lbs (2,162 kg)
- 405 miles (652 km) of EPA est. range
- battery capacity: N/A
- 0-60 mph (96.5 km/h) in 3.1 seconds
- top speed of 155 mph (249 km)
- dual motor, all-wheel drive (one motor in the front and one in the rear)
- system output: 670 hp (about 499 kW)
- DC fast charging: at up to 250 kW (Superchargers)
can replenish 187 miles (301 km) in 15 minutes - Drag Coefficient 0.208 Cd
- Wheels 19" or 21"
- Cargo 28 cu ft
- Weight 4,561 lbs (2,069 kg)
SOURCE: INSIDEEVs
Sponsored

")