Sponsored

marwal

Member
Joined
Aug 12, 2024
Threads
0
Messages
12
Reaction score
5
Location
Phoenix, AZ
Vehicles
FS Cyberbeast
Country flag
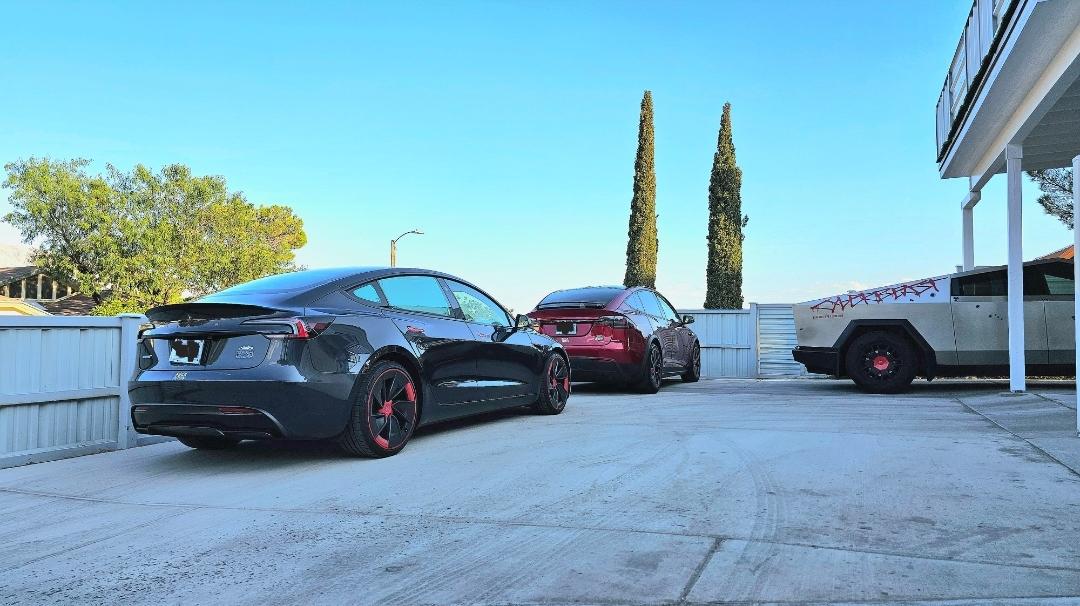
Can anyone help me here?!? My first EV and I feel like I’m getting terrible range. I’ve drove my Beast 550 miles and charged 530kwh so far. Im currently parked at 60% battery. What is my range b/c that seems awful compared to others :) Any suggestions? I don’t leave overheat protection on anymore. I live in AZ where it is very hot obviously.
Sponsored


Jerry A

Member
First Name
Jerry
Joined
Jul 29, 2024
Threads
1
Messages
9
Reaction score
9
Location
Oak Creek, CO
Vehicles
Cyber Truck
Occupation
Retired
Country flag
I would probably be at 345-355 Wh/mile if ~25% of the 3,000 miles wasn't off-road. Instead I'm at 393 Wh/mile lifetime average and that includes plenty of full-throttle launches. I'm sure it will change for the worse when colder weather arrives, because my Cybertruck lives out in the weather 24/7.
I've only got a little over 2,000 miles highway and city driving. Right now at 355.
 

Hunky Dory

Well-known member
First Name
David
Joined
Jul 31, 2024
Threads
0
Messages
101
Reaction score
233
Location
Wyoming
Vehicles
Buick Encore, Grey Cyberbeast FS
Occupation
Retired
Country flag
Very good info. I am wondering about the speed rating of those AS tires. If the information I am seeing is correct, the top speed of the AWD is 112 mph and and CB is 130 mph. That would make the required speed rating S for 112 mph and H for 130 mph. Personally I doubt I will ever go over about 90 on the freeway.
 

RayzorBEV

Well-known member
Joined
Dec 8, 2019
Threads
5
Messages
1,670
Reaction score
3,694
Location
Texas
Vehicles
H-M3 P, CB FS, CB FS, CB, J-MY P, Zero S ZF
Occupation
Electric Bum
Country flag
I knew it! With AS tires, Cybertruck is actually very efficient. Even my Cyberbeast on 35in AT tires gets similar efficiency as my 2024 Model X Plaid. Great job Tesla ?

Tesla Cybertruck All Season Tires (Pirelli Scorpion AS) + 20" Inch Core Wheels + Wheel Covers Are Here! -- My Real World Range / Consumption Data 📊 Screenshot_20240818_082033_Gallery
 

Tinker71

Well-known member
First Name
Ray
Joined
Aug 8, 2020
Threads
93
Messages
1,610
Reaction score
2,102
Location
Utah
Vehicles
1976 VW EV bus, 2007 Sienna, Tesla M3, Cancelled CT2 rez - holding for $65k
Occupation
Project Manager
Country flag
This is correct. There is no range bump.
I don't think Gen 3 (dry cathode) batteries have not made it to installation in the CT. If they have, Tesla is or will range limit them. Tesla is very careful with the Osborne effect. They don't want people to wait for 3 more months to buy, when they can get a 40% margin now. I predict they will announce them as late as possible. They might even make people pay for the extra 10%? energy density or they will install fewer cells.

The dry cathode battery is both a cost savings and small density boost.


OP
OP

MadMaxTX

Well-known member
Joined
May 24, 2024
Threads
4
Messages
86
Reaction score
124
Location
TX
Vehicles
Cybertruck
Country flag
There is too much bullshit here for one post.

The 123 kWh battery size does not come from multiplying the number of 4680 cells by the rated capacity per battery, it comes from Tesla's published average range and consumption figures and has been verified by other parties through testing. The actual battery capacity is higher than 123 kWh but that doesn't even matter because it's not available to use. All EV batteries have capacity that is not available to use.
Well, that's a pretty aggressive response but I am interested in what information you can share. Please share a link that will show Tesla's statement of battery capacity. I can't find one (from Tesla) and everything I find complains that Tesla doesn't share this information. Then, they go on to use range estimates Tesla gave to the EPA to back into the battery size. Tear downs show 1344 cells, so multiplying by cell capacity gives information, but not the entire story. For example, I'd be interested to see documentation as to how the vehicle makes the decision to shut down. Going way back in my EV life, the Nissan leaf would continue on for some time after it reported it had zero charge left for example. There is some floor (it was reported to be 3.0 v back in Roadster days) they use and it would be nice to know about that when puzzling it all out. As for actual cell capacity, there are lab studies on the original Cybertruck 4680 that show by physical testing it has 86.5 wh per cell which you can see here:
https://www.batterydesign.net/tesla-4680-cell

After the Q2 '23 Tesla Earnings Call, where it was stated 4680 Gen 2 had a 10% gain, they put that into the equation (no physical testing this time) to get about 95 wh per cell. Technically, I understand this gain is in wh/kg, but everyone assumes that this gain will go into higher pack capacity rather than to reduce weight so they use it as a proxy for new capacity. So, if you multiply these estimates out (1344*86.5 and 1344*95) they lead to Gen 1 is 116kwh and Gen 2 126.7kwh.

Having said all of this, there are some puzzling observations from Teslas themselves and what leads me to use around 115kwh for my estimate of useable range. Here's an experiment I did. Charge to 80%, do some driving that takes the battery to 56%. That means I used 24% of the capacity, and "since last charge" shows 72 miles, 27kwh and 368 wh/mile. As these lack precision, I used 72 miles* 368wh/mile = 26.496kwh. Dividing by .24, implies total battery capacity is 110.4. It had just turned over to .24, so if I use .23, then it's about 115kwh. My guess is that I have Gen 1 batteries in my CT but just a guess. At least that fits with experimental data and with the estimate from my car.
 
OP
OP

MadMaxTX

Well-known member
Joined
May 24, 2024
Threads
4
Messages
86
Reaction score
124
Location
TX
Vehicles
Cybertruck
Country flag
Here are consumption value tests I did today. While one could work these into "range estimates", it would only have meaning for the type of tests I did. The goal of this test is I want to know approximately how much extra energy is used at these different speeds.

The tests were done in freeway only driving. First I warmed the systems up by driving about 5 miles to the nearest freeway. Then, accelerated to 60 mph, engaged cruise control and reset the trip computation. I held the speed on cruise control (chill profile) until the energy estimate stabilized and a few more minutes after (total of 8 minutes). After noting energy consumptions, I repeated the process for 65, 70 and 75 mph, resetting the calculation at each level. The terrain is essentially flat, but the freeway has frequent overpasses, so there was variation in elevation, but gentle, small and reciprocal -- they generally go down as much as they went up. It was Sunday morning, very little traffic so I could maintain constant speed without trouble. Very light and variable wind, temperature about 91 degrees.

Configuration: AWD tactical grey, AS tires.

Speed............Consumption.........percent consumption increase (over previous speed)
60 mph..........323wh/mile
65 mph...........332wh/mile...............2.8%
70 mph............390wh/mile.............17.5%
75 mph............442wh/mile.............13.3%

So, that's something to think about. I can't explain the big bump at 70 mph, but that's what we got. Maybe someone has some insight into that.

Caveats: Remember, this only simulates constant speed driving under fairly advantageous conditions. Also, in case direction of test made a difference, I made two measurements, outbound and then reversed the route coming home. I found the retuning numbers a little larger which I could not explain since there's very little wind. Then, I realized that since I had travelled south towards the coast, the elevation was lower at the turnaround point which would be a factor that could explain it. It was very small, around 1% variation depending on the direction, but pretty consistent.

This is interesting, but we are doing a long road trip in a few weeks so there will be good chances to learn a lot more.

We all know that speed kills, but this tells you how quickly! But, I love this machine. At 75, steady as a rock, smooth and quiet.
 

shellac

Active member
Joined
Jul 21, 2024
Threads
0
Messages
28
Reaction score
22
Location
New Orleans
Vehicles
CT AWD, Model 3 LR
Occupation
MD
Country flag
I have the AT tires on Cyber wheels currently. In the future one can always change to the AS tires right? Is there anything special about the Core wheels that would make them necessary for AS?
 

igs

Well-known member
Joined
Aug 7, 2023
Threads
45
Messages
1,183
Reaction score
1,731
Location
CA
Vehicles
CT, MX, MY
Occupation
Tesla: "To maintain service life, the battery pack should be stored at a state of charge (SOC) of 15 to 50%."
Country flag
I have the AT tires on Cyber wheels currently. In the future one can always change to the AS tires right? Is there anything special about the Core wheels that would make them necessary for AS?
Core wheels are lighter. Cyber covers would look weird on non-AT tires.
 

HaulingAss

Well-known member
Joined
Oct 3, 2020
Threads
28
Messages
10,426
Reaction score
20,964
Location
Western Washington, USA
Vehicles
Cybertruck DM, 2010 F-150, 2018 Performance Model 3, 2024 Performance Model 3
Country flag
Here are consumption value tests I did today. While one could work these into "range estimates", it would only have meaning for the type of tests I did. The goal of this test is I want to know approximately how much extra energy is used at these different speeds.

The tests were done in freeway only driving. First I warmed the systems up by driving about 5 miles to the nearest freeway. Then, accelerated to 60 mph, engaged cruise control and reset the trip computation. I held the speed on cruise control (chill profile) until the energy estimate stabilized and a few more minutes after (total of 8 minutes). After noting energy consumptions, I repeated the process for 65, 70 and 75 mph, resetting the calculation at each level. The terrain is essentially flat, but the freeway has frequent overpasses, so there was variation in elevation, but gentle, small and reciprocal -- they generally go down as much as they went up. It was Sunday morning, very little traffic so I could maintain constant speed without trouble. Very light and variable wind, temperature about 91 degrees.

Configuration: AWD tactical grey, AS tires.

Speed............Consumption.........percent consumption increase (over previous speed)
60 mph..........323wh/mile
65 mph...........332wh/mile...............2.8%
70 mph............390wh/mile.............17.5%
75 mph............442wh/mile.............13.3%

So, that's something to think about. I can't explain the big bump at 70 mph, but that's what we got. Maybe someone has some insight into that.

Caveats: Remember, this only simulates constant speed driving under fairly advantageous conditions. Also, in case direction of test made a difference, I made two measurements, outbound and then reversed the route coming home. I found the retuning numbers a little larger which I could not explain since there's very little wind. Then, I realized that since I had travelled south towards the coast, the elevation was lower at the turnaround point which would be a factor that could explain it. It was very small, around 1% variation depending on the direction, but pretty consistent.

This is interesting, but we are doing a long road trip in a few weeks so there will be good chances to learn a lot more.

We all know that speed kills, but this tells you how quickly! But, I love this machine. At 75, steady as a rock, smooth and quiet.
If those are steady speed state consumption figures under generally neutral/not unfavorable conditions, then I think my Cybertruck probably comes in significantly lower, especially at the 60-70 mph range. Keep in mind that the efficiency of any model has a certain natural variation depending upon things like the exact wheel alignment (of which there is a range of values that are considered "in spec").

Most interesting in your analysis is the jump in consumption between 65 and 70 mph.

Before the Cybertruck was released to the public, I predicted there would be a sharp jump in consumption somewhere between 60 and 70 mph (based upon my guess that that's the speed range at which there would be a separation of the airflow over the top peak of the truck).

I have no idea how well your measurements avoided inaccuracies due to prevailing breezes or other factors, but I do think the effect your data shows is probably near the point at which the airflow over the top of the truck separates.


Speedr

Well-known member
Joined
Dec 17, 2023
Threads
15
Messages
665
Reaction score
1,403
Location
Florida
Vehicles
Dual Motor Cybertruck
Country flag
Here are consumption value tests I did today. While one could work these into "range estimates", it would only have meaning for the type of tests I did. The goal of this test is I want to know approximately how much extra energy is used at these different speeds.

The tests were done in freeway only driving. First I warmed the systems up by driving about 5 miles to the nearest freeway. Then, accelerated to 60 mph, engaged cruise control and reset the trip computation. I held the speed on cruise control (chill profile) until the energy estimate stabilized and a few more minutes after (total of 8 minutes). After noting energy consumptions, I repeated the process for 65, 70 and 75 mph, resetting the calculation at each level. The terrain is essentially flat, but the freeway has frequent overpasses, so there was variation in elevation, but gentle, small and reciprocal -- they generally go down as much as they went up. It was Sunday morning, very little traffic so I could maintain constant speed without trouble. Very light and variable wind, temperature about 91 degrees.

Configuration: AWD tactical grey, AS tires.

Speed............Consumption.........percent consumption increase (over previous speed)
60 mph..........323wh/mile
65 mph...........332wh/mile...............2.8%
70 mph............390wh/mile.............17.5%
75 mph............442wh/mile.............13.3%

So, that's something to think about. I can't explain the big bump at 70 mph, but that's what we got. Maybe someone has some insight into that.

Caveats: Remember, this only simulates constant speed driving under fairly advantageous conditions. Also, in case direction of test made a difference, I made two measurements, outbound and then reversed the route coming home. I found the retuning numbers a little larger which I could not explain since there's very little wind. Then, I realized that since I had travelled south towards the coast, the elevation was lower at the turnaround point which would be a factor that could explain it. It was very small, around 1% variation depending on the direction, but pretty consistent.

This is interesting, but we are doing a long road trip in a few weeks so there will be good chances to learn a lot more.

We all know that speed kills, but this tells you how quickly! But, I love this machine. At 75, steady as a rock, smooth and quiet.
Thank you for doing this!!!

BTW, this shows quite well the old EV adage:

The slower you go, the faster you get there!

On long trips, it's usually faster to go the speed limit in between supercharging vs. speeding to the next supercharger, where you have to stop at an earlier one and charge longer.
 

HaulingAss

Well-known member
Joined
Oct 3, 2020
Threads
28
Messages
10,426
Reaction score
20,964
Location
Western Washington, USA
Vehicles
Cybertruck DM, 2010 F-150, 2018 Performance Model 3, 2024 Performance Model 3
Country flag
Thank you for doing this!!!

BTW, this shows quite well the old EV adage:

The slower you go, the faster you get there!

On long trips, it's usually faster to go the speed limit in between supercharging vs. speeding to the next supercharger, where you have to stop at an earlier one and charge longer.
I haven't taken any Supercharger trips in the Cybertruck but I can tell you the adage is absolutely not even close to being true for a Model 3 or a Model S. I can get to Montana a LOT quicker if I'm going triple digit speeds wherever possible. That's because I'm often charging at over 1000 miles of gained charge per hour. You do the math.

Another way to prove this is to look at the EV Canonball Run record holders. They all travelled at 90-110 mph (or more) when possible. They wouldn't be record holders if driving faster was actually slower. That disproves the adage that slower is faster right there!

Now the Cybertruck will have different metrics. For sure it's a lot less expensive to take your time, and it's probably not very much more productive to go 90 mph than 65 mph, but, if it were a race, I'm confident the person going 90 mph would win. That assumes, of course, that they are charging in the lower half of of the battery, say from 10-50 or 60%, not 30-80%.

I'm not advocating for driving at high speeds, I'm simply saying it's false that driving faster is slower, when done properly. Of course there are limited situations where driving slower will get you there faster but they all involve legs that have very large distances between available Superchargers. That's because very long trip segments force charging past 60% if you go too fast. Fortunately, Supercharger density on most Interstates is high enough that this is not the normal situation.
 

TrukduSyber

Active member
First Name
Lou
Joined
Oct 12, 2023
Threads
1
Messages
27
Reaction score
40
Location
NY
Vehicles
Type R
Occupation
IT Director
Country flag
Well, that's a pretty aggressive response but I am interested in what information you can share. Please share a link that will show Tesla's statement of battery capacity. I can't find one (from Tesla) and everything I find complains that Tesla doesn't share this information. Then, they go on to use range estimates Tesla gave to the EPA to back into the battery size. Tear downs show 1344 cells, so multiplying by cell capacity gives information, but not the entire story. For example, I'd be interested to see documentation as to how the vehicle makes the decision to shut down. Going way back in my EV life, the Nissan leaf would continue on for some time after it reported it had zero charge left for example. There is some floor (it was reported to be 3.0 v back in Roadster days) they use and it would be nice to know about that when puzzling it all out. As for actual cell capacity, there are lab studies on the original Cybertruck 4680 that show by physical testing it has 86.5 wh per cell which you can see here:
https://www.batterydesign.net/tesla-4680-cell

After the Q2 '23 Tesla Earnings Call, where it was stated 4680 Gen 2 had a 10% gain, they put that into the equation (no physical testing this time) to get about 95 wh per cell. Technically, I understand this gain is in wh/kg, but everyone assumes that this gain will go into higher pack capacity rather than to reduce weight so they use it as a proxy for new capacity. So, if you multiply these estimates out (1344*86.5 and 1344*95) they lead to Gen 1 is 116kwh and Gen 2 126.7kwh.

Having said all of this, there are some puzzling observations from Teslas themselves and what leads me to use around 115kwh for my estimate of useable range. Here's an experiment I did. Charge to 80%, do some driving that takes the battery to 56%. That means I used 24% of the capacity, and "since last charge" shows 72 miles, 27kwh and 368 wh/mile. As these lack precision, I used 72 miles* 368wh/mile = 26.496kwh. Dividing by .24, implies total battery capacity is 110.4. It had just turned over to .24, so if I use .23, then it's about 115kwh. My guess is that I have Gen 1 batteries in my CT but just a guess. At least that fits with experimental data and with the estimate from my car.

Actually independent testing shows exactly 123 KWH battery. Out of Spec did this review where they showed exactly that. The gals/guys at OOS are huge battery/efficiency nerds and they go into extreme detailed long af videos.


fast forward to 1:40:49 for the final data point of running until dead - clocked in at exactly 123 kwh

Note this video was done 4 maybe 5 months ago. There probably have been some improvements since then.
 

Speedr

Well-known member
Joined
Dec 17, 2023
Threads
15
Messages
665
Reaction score
1,403
Location
Florida
Vehicles
Dual Motor Cybertruck
Country flag
I haven't taken any Supercharger trips in the Cybertruck but I can tell you the adage is absolutely not even close to being true for a Model 3 or a Model S. I can get to Montana a LOT quicker if I'm going triple digit speeds wherever possible. That's because I'm often charging at over 1000 miles of gained charge per hour. You do the math.

Another way to prove this is to look at the EV Canonball Run record holders. They all travelled at 90-110 mph (or more) when possible. They wouldn't be record holders if driving faster was actually slower. That disproves the adage that slower is faster right there!

Now the Cybertruck will have different metrics. For sure it's a lot less expensive to take your time, and it's probably not very much more productive to go 90 mph than 65 mph, but, if it were a race, I'm confident the person going 90 mph would win. That assumes, of course, that they are charging in the lower half of of the battery, say from 10-50 or 60%, not 30-80%.

I'm not advocating for driving at high speeds, I'm simply saying it's false that driving faster is slower, when done properly. Of course there are limited situations where driving slower will get you there faster but they all involve legs that have very large distances between available Superchargers. That's because very long trip segments force charging past 60% if you go too fast. Fortunately, Supercharger density on most Interstates is high enough that this is not the normal situation.
I was specifically talking about NORMAL speeds (i.e. going 70-75 vs. 80-85 on most interstates where 70 is the speed limit). Also, the Cybertruck does not charge anywhere near 1,000 miles per hour (yet!). When I had my 2017 Model S 100D, this was very much true, and I'd argue that the Cybertruck is similar, if not worse. We're traveling across the state next month, and I will report back on both speed ranges and charging times...
 

Speedr

Well-known member
Joined
Dec 17, 2023
Threads
15
Messages
665
Reaction score
1,403
Location
Florida
Vehicles
Dual Motor Cybertruck
Country flag
Actually independent testing shows exactly 123 KWH battery. Out of Spec did this review where they showed exactly that. The gals/guys at OOS are huge battery/efficiency nerds and they go into extreme detailed long af videos.


fast forward to 1:40:49 for the final data point of running until dead - clocked in at exactly 123 kwh

Note this video was done 4 maybe 5 months ago. There probably have been some improvements since then.
There have been improvements to the charging curve for sure. Cell chemistry/density I doubt...yet anyways.
Sponsored


Top