BayouCityBob
Well-known member
- Joined
- Apr 14, 2022
- Threads
- 24
- Messages
- 495
- Reaction score
- 1,569
- Location
- Texas
- Vehicles
- 2018 Model 3
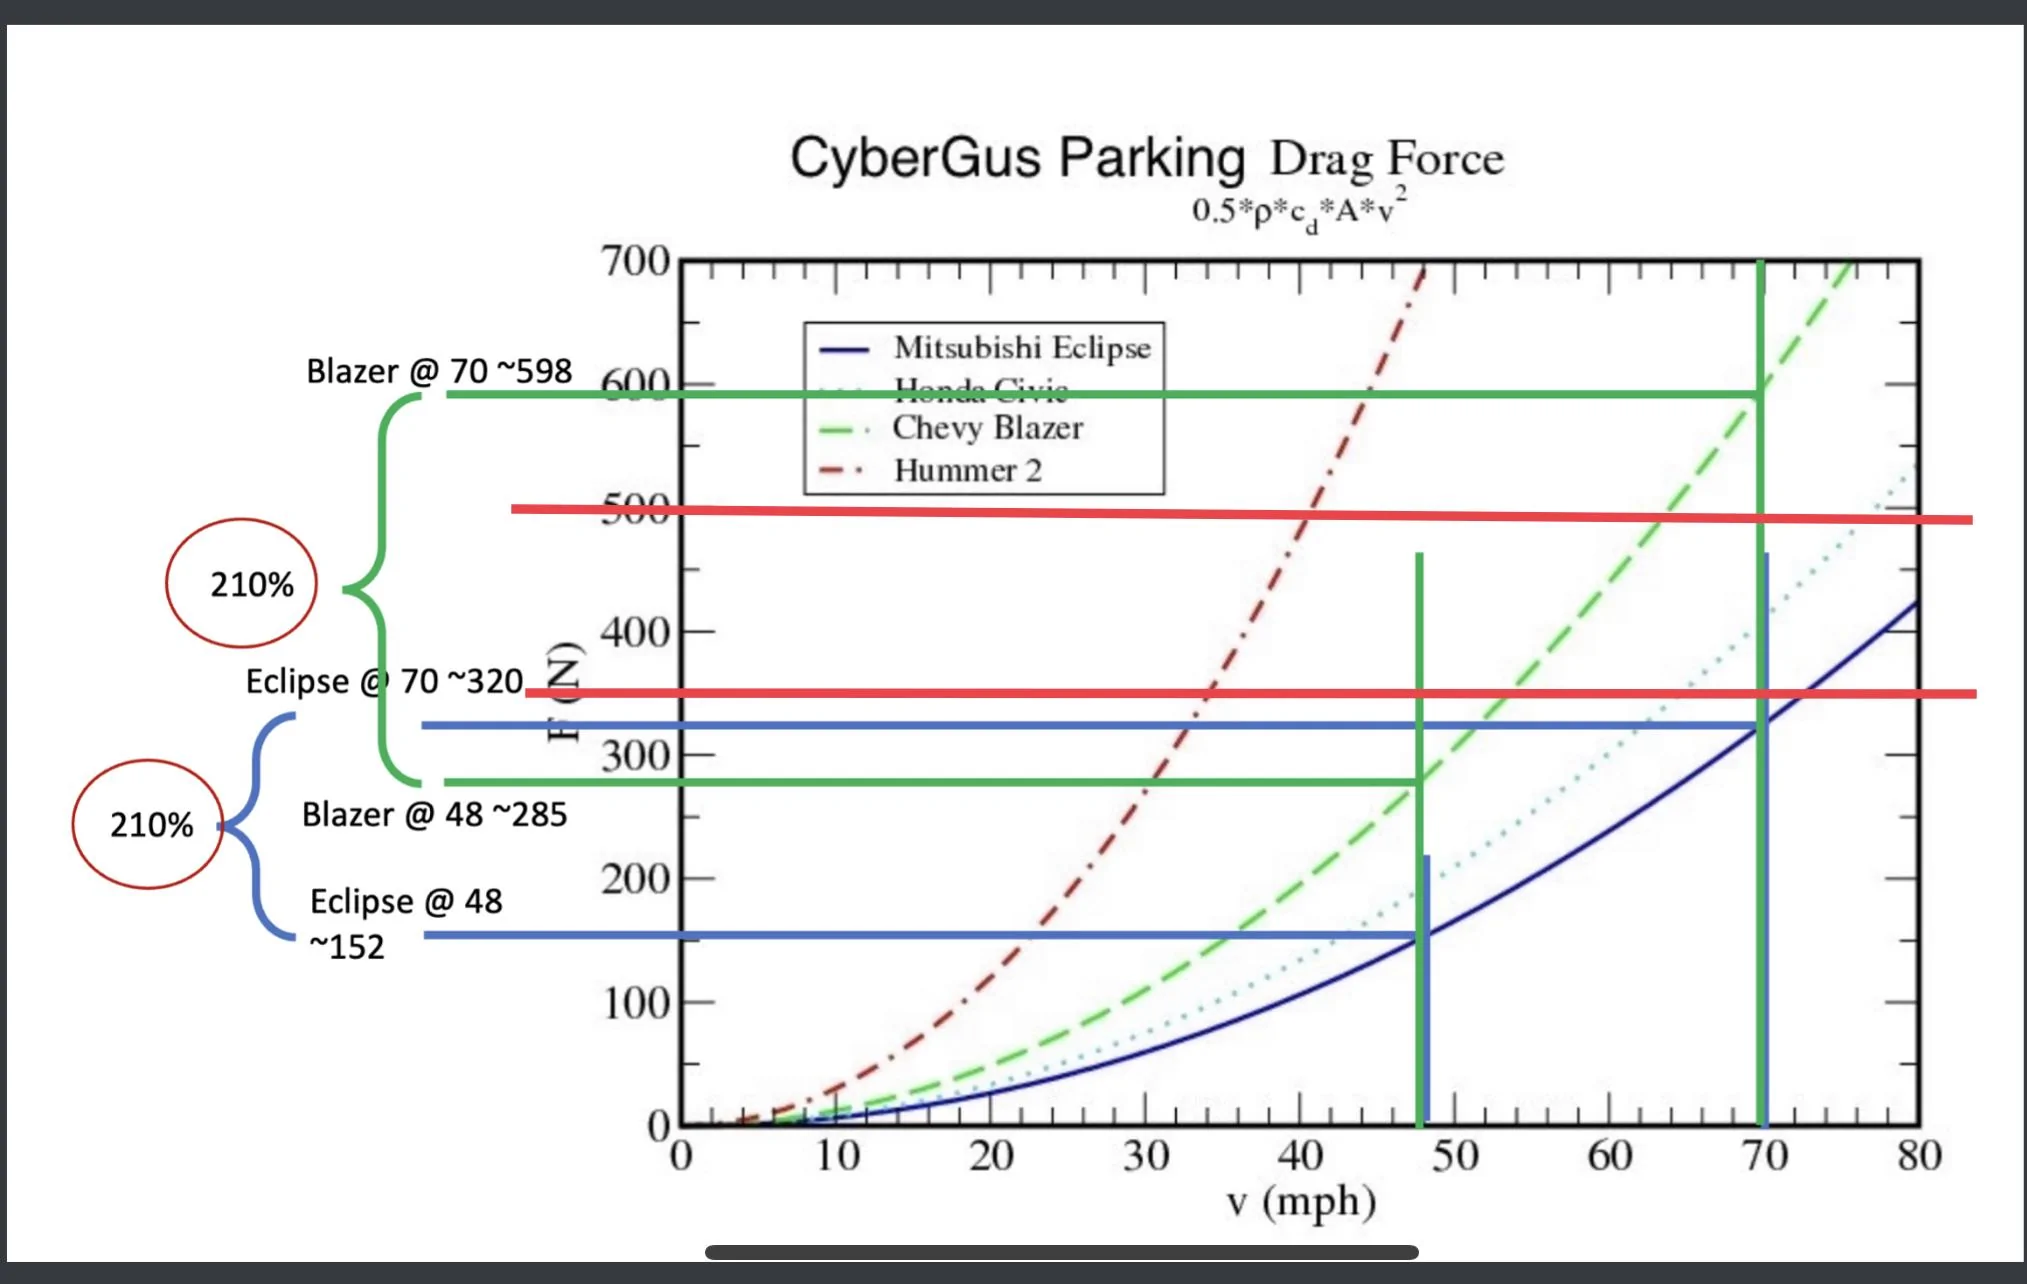
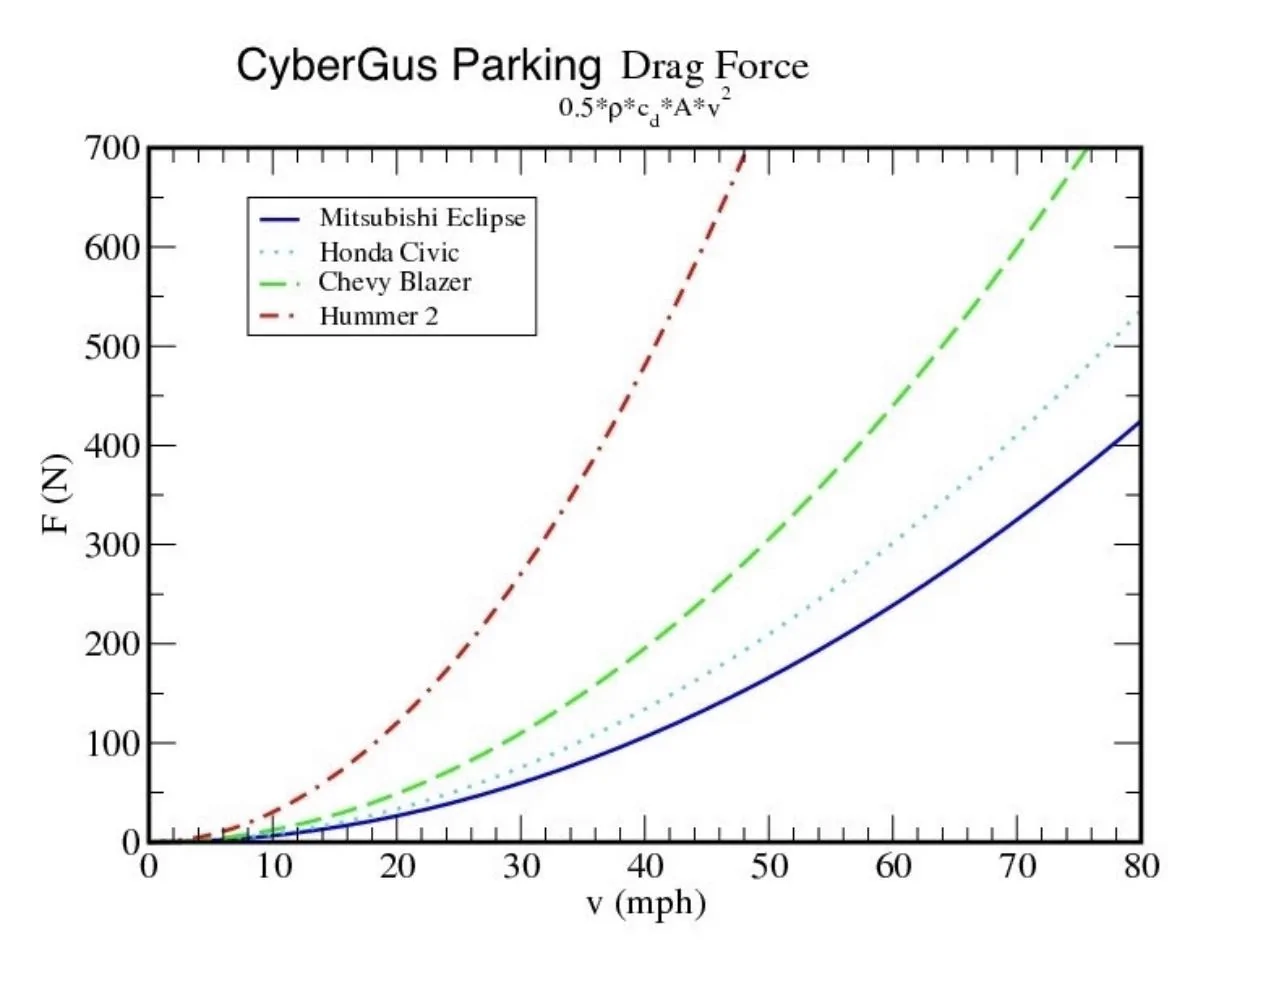
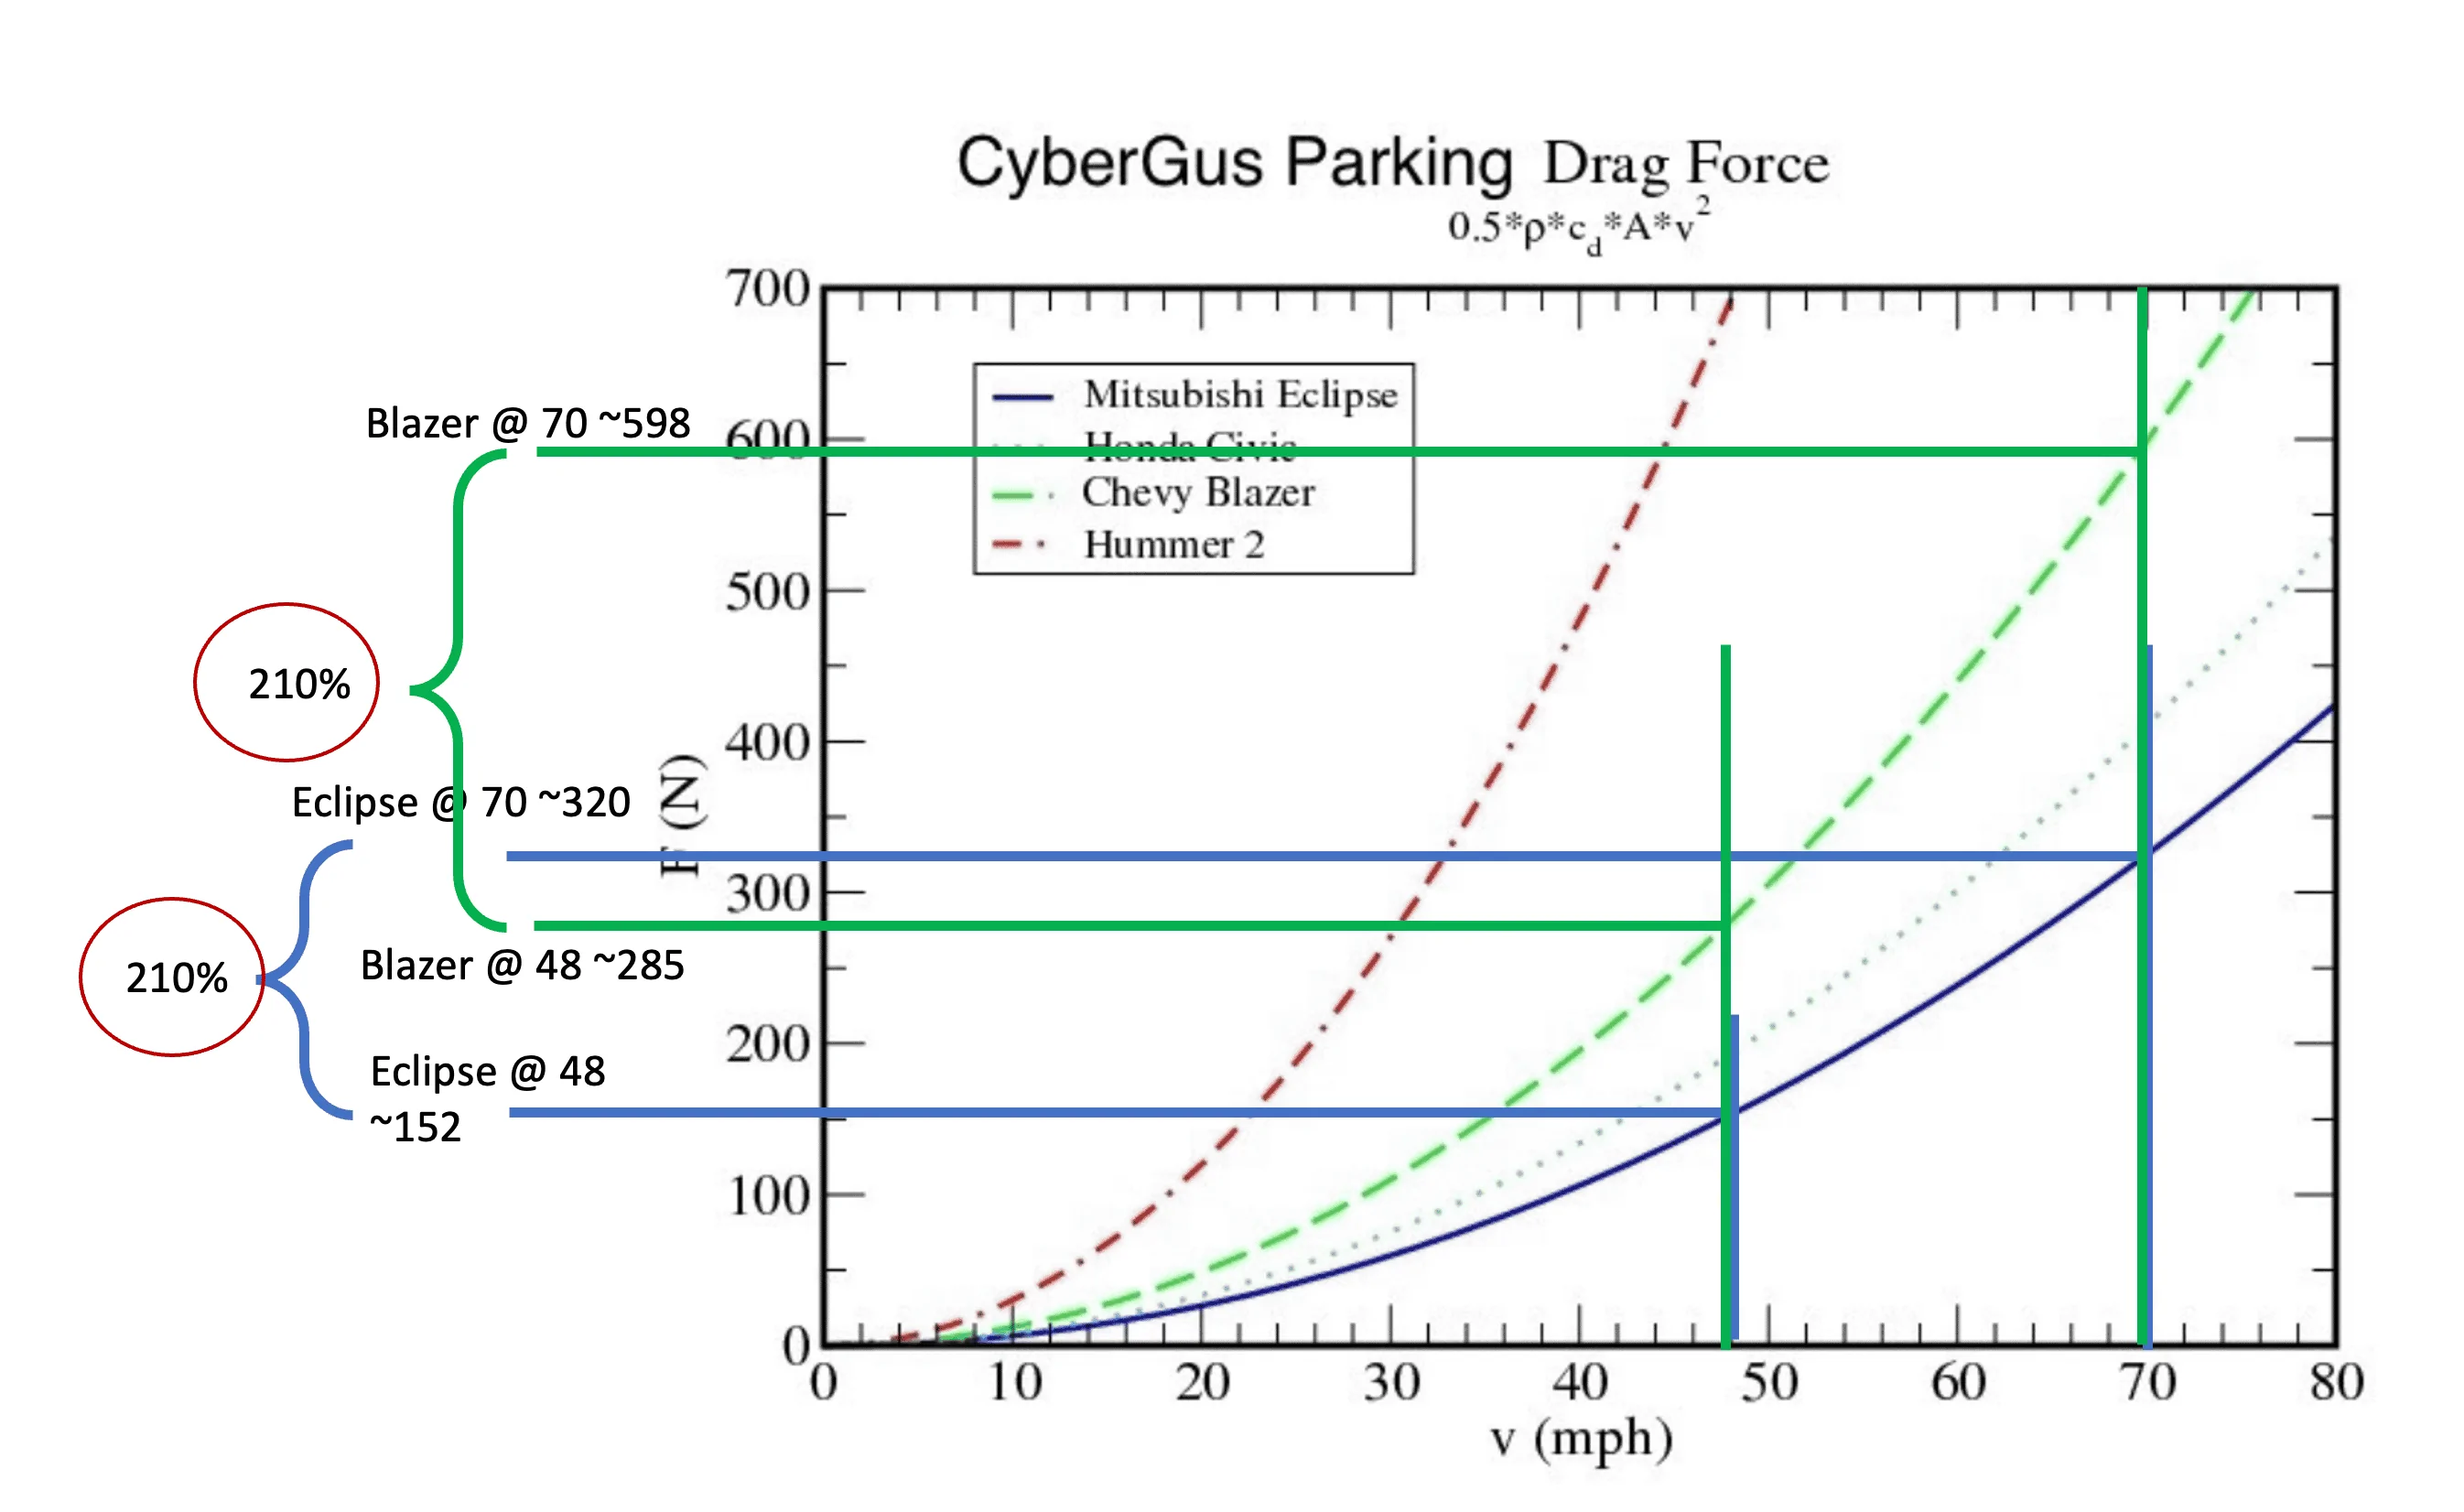
I think you will find that in your chart the percentage of additional energy required to go from say 48 mph to 70 mph is the same for the Eclipse or the Blazer. So if both start with enough energy to go the same distance at 48 mph then they will be able to go the same (shorter) distance at 70 even though the Blazer will consume far more energy in total. At least that is how I see it.I think the underlined is possibly your error
As speed increases, the drag force on the vehicle will increase more steeply for the CT than for the MY.

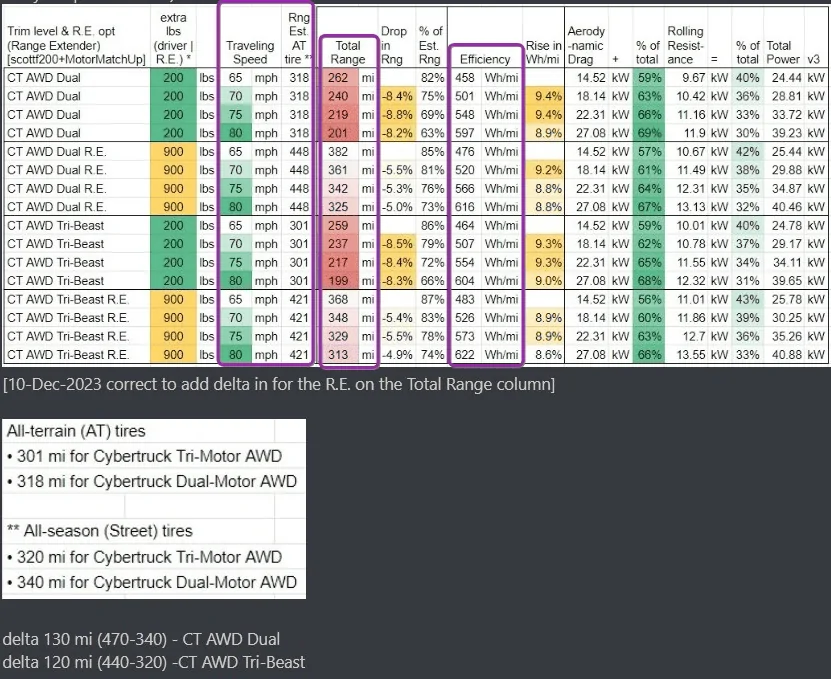
Their parity in range at EPA conditions is basically an artifact of the relevant battery size as relates to their respective frontal plane/Cd.
Meanwhike, there are other factors at play, such as the power-torque curve of the engine and selected gear reduction, which can affect relevant range as well. And here, the CT’s ‘sweet spot’ is possibly ‘tuned’ different/worse ar upper highway speeds than a MY, since the CT is also ‘tuned’ for low end power/torque for off-road/towing/rock crawling.
Sponsored