Mini2nut
Well-known member
- Joined
- Apr 2, 2020
- Threads
- 137
- Messages
- 4,064
- Reaction score
- 7,375
- Location
- Planet Earth
- Vehicles
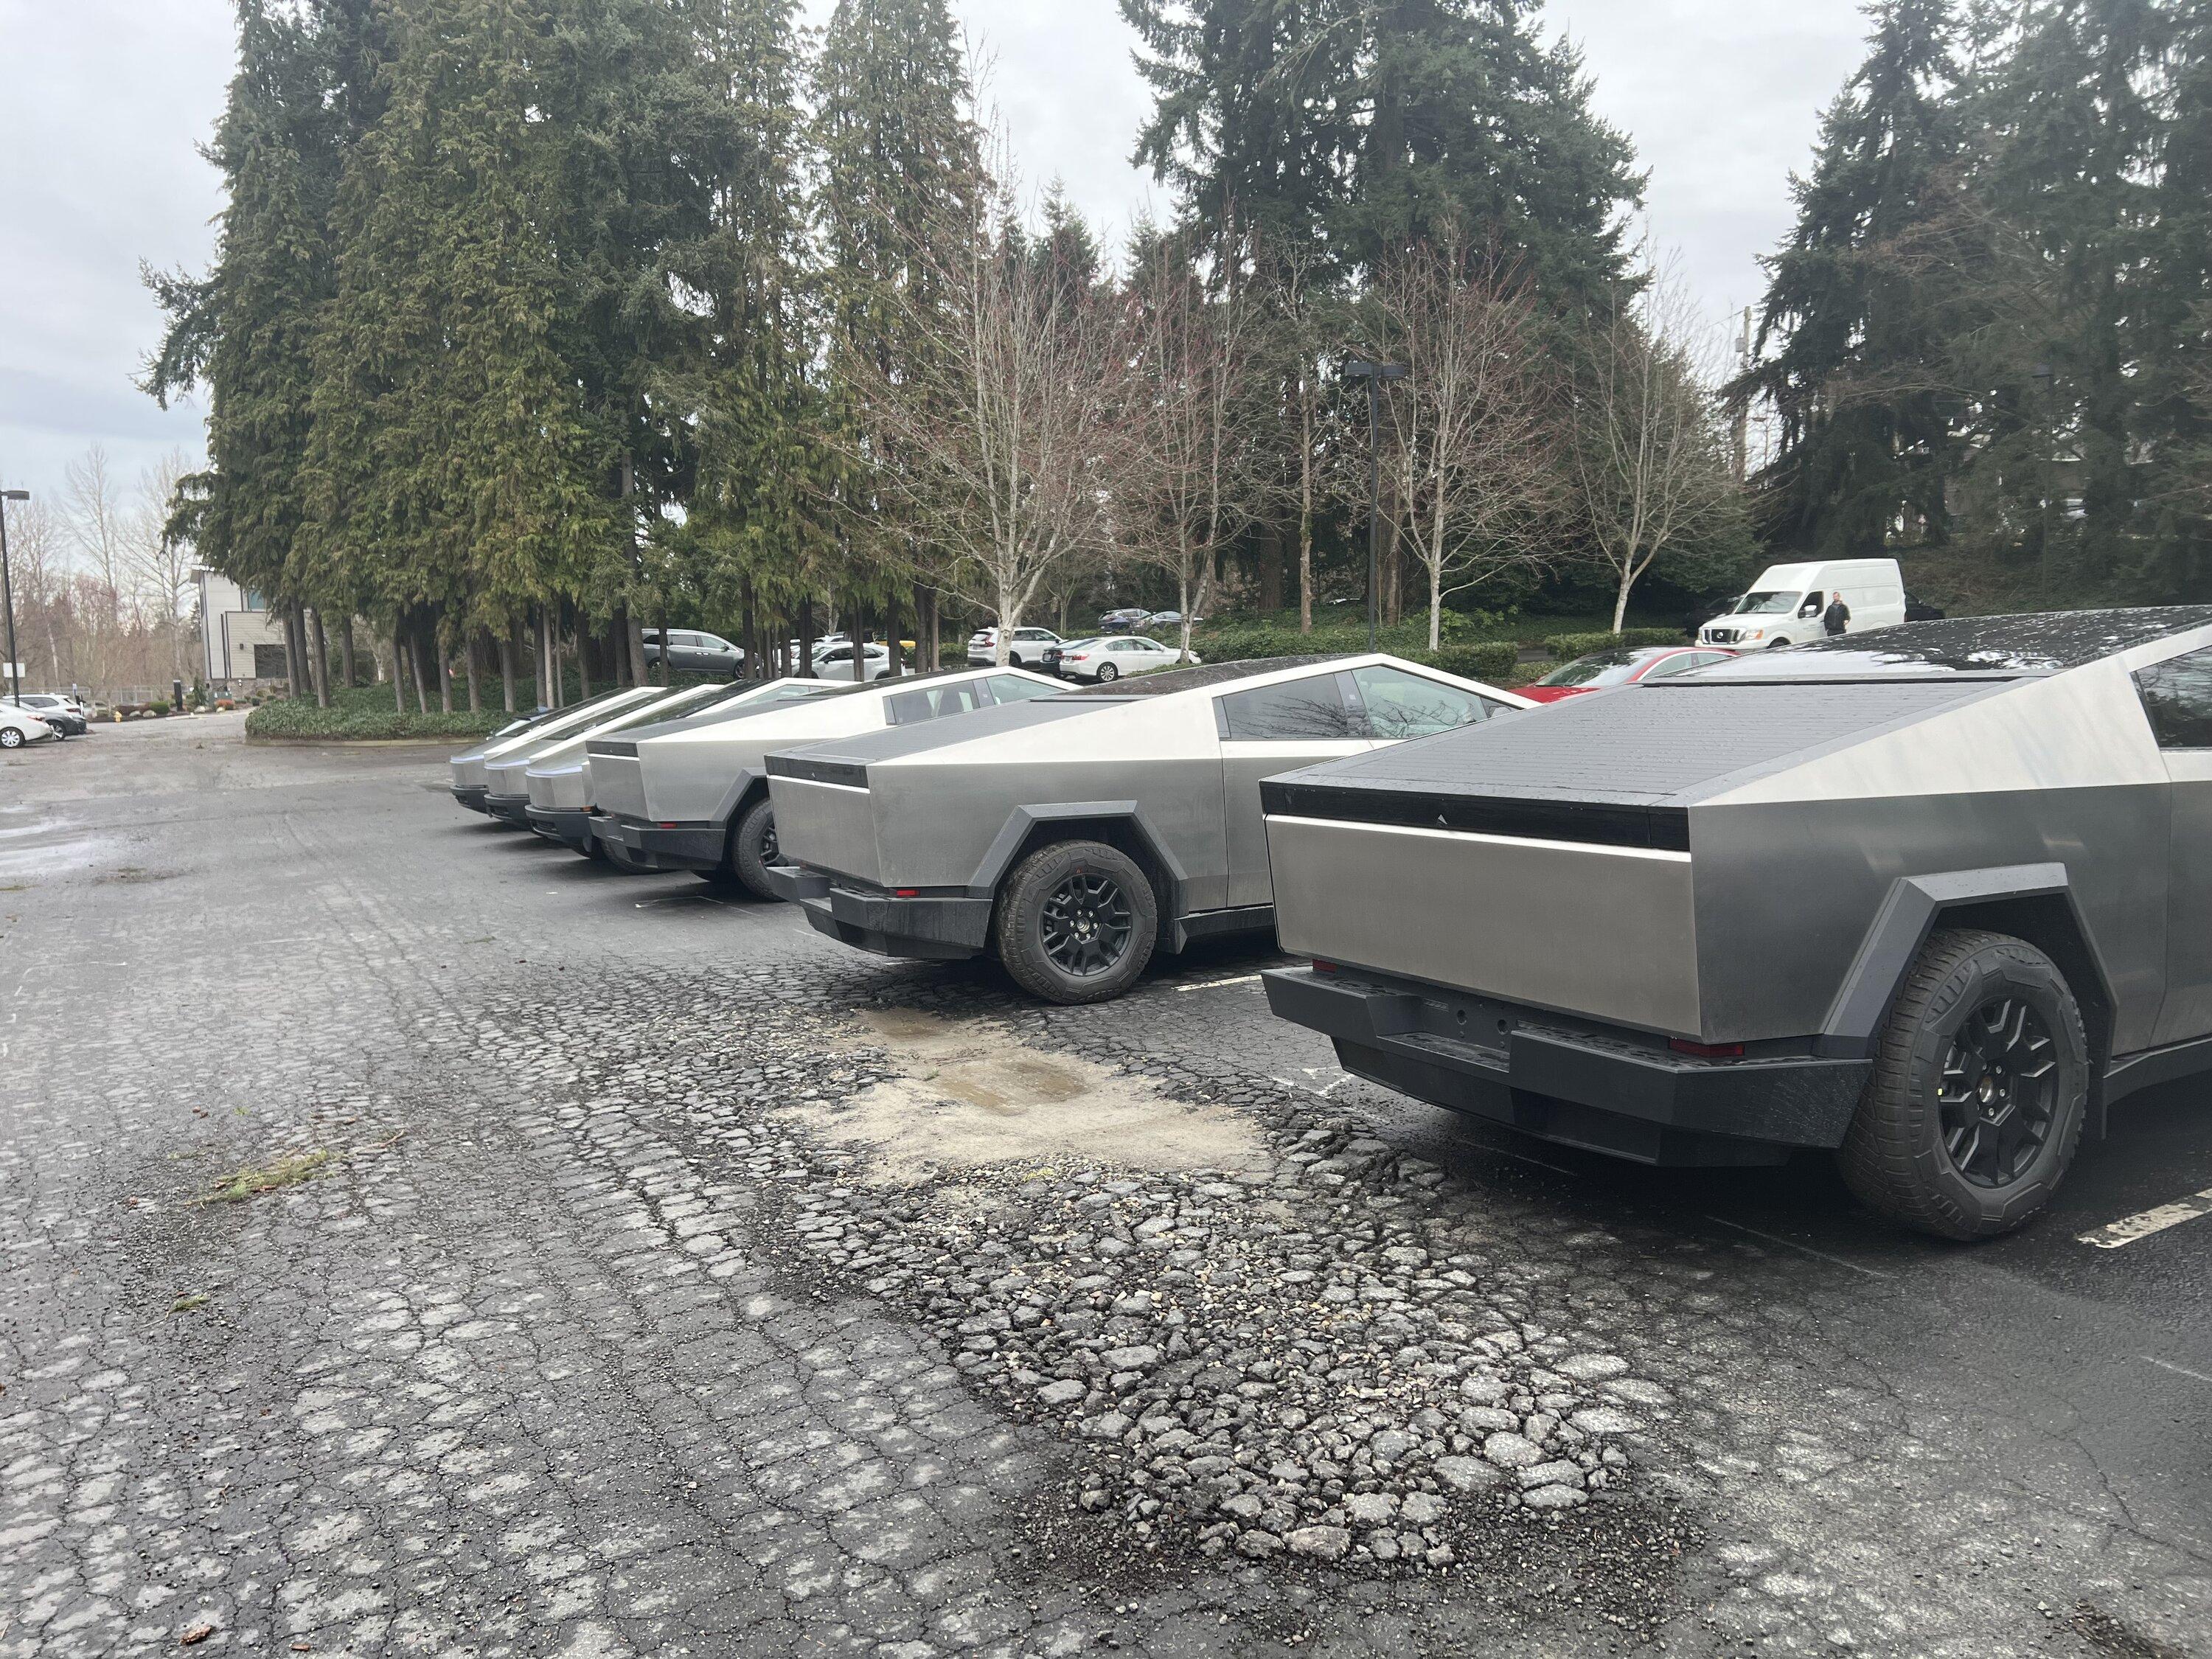
- *Tesla MYP *SAWD Cybertruck ordered 2/20/26
Adding second shift will be encouraging as long as suppliers can keep up. Production will only be as fast as your slowest arriving parts.
Sponsored